Copyright
©2013 Baishideng Publishing Group Co.
World J Gastroenterol. Jun 14, 2013; 19(22): 3512-3516
Published online Jun 14, 2013. doi: 10.3748/wjg.v19.i22.3512
Published online Jun 14, 2013. doi: 10.3748/wjg.v19.i22.3512
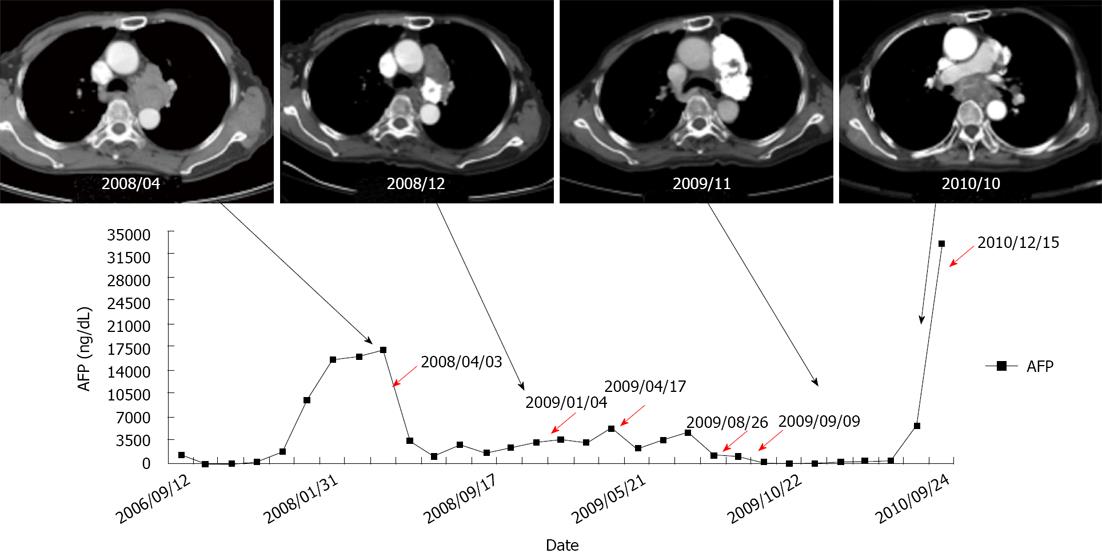
Figure 4 Alpha-fetoprotein levels in time course of treatment.
Every session of transarterial embolization is shown with a red arrow. The computed tomography (CT) images represented the progression of mediastinal tumor and treatment response of transarterial embolization. The CT image on the far right was taken about three months before death of the patient. The tumor compressed the left bronchus, which may explain the cause of the patient’s pneumonia.
- Citation: Chen CC, Yeh HZ, Chang CS, Ko CW, Lien HC, Wu CY, Hung SW. Transarterial embolization of metastatic mediastinal hepatocellular carcinoma. World J Gastroenterol 2013; 19(22): 3512-3516
- URL: https://www.wjgnet.com/1007-9327/full/v19/i22/3512.htm
- DOI: https://dx.doi.org/10.3748/wjg.v19.i22.3512


