Copyright
©2013 Baishideng Publishing Group Co.
World J Gastroenterol. Jun 14, 2013; 19(22): 3423-3432
Published online Jun 14, 2013. doi: 10.3748/wjg.v19.i22.3423
Published online Jun 14, 2013. doi: 10.3748/wjg.v19.i22.3423
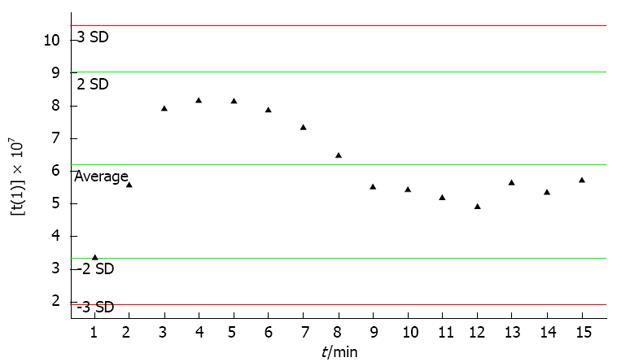
Figure 3 Score plot of principal component [t(1)] for quality control principal component analysis model.
Each point represents a quality control sample.
- Citation: Liu SY, Zhang RL, Kang H, Fan ZJ, Du Z. Human liver tissue metabolic profiling research on hepatitis B virus-related hepatocellular carcinoma. World J Gastroenterol 2013; 19(22): 3423-3432
- URL: https://www.wjgnet.com/1007-9327/full/v19/i22/3423.htm
- DOI: https://dx.doi.org/10.3748/wjg.v19.i22.3423


