Copyright
©2013 Baishideng Publishing Group Co.
World J Gastroenterol. Jun 14, 2013; 19(22): 3404-3414
Published online Jun 14, 2013. doi: 10.3748/wjg.v19.i22.3404
Published online Jun 14, 2013. doi: 10.3748/wjg.v19.i22.3404
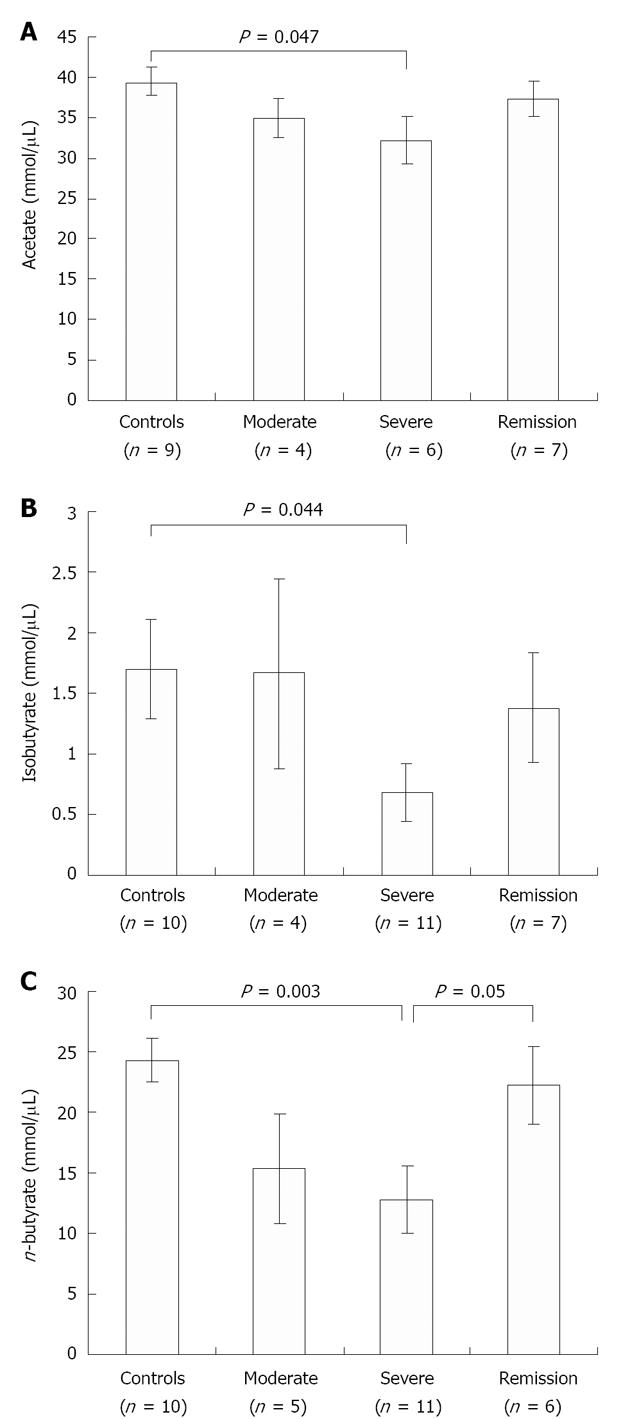
Figure 3 Short chain fatty acids in fecal samples of ulcerative colitis patients vs control samples, analyzed by gas chromatography.
A: Acetate; B: Iso-butyrate; C: Butyrate. The Y axis represents concentration of respective short chain fatty acid and X axis represents the sample category.
- Citation: Kumari R, Ahuja V, Paul J. Fluctuations in butyrate-producing bacteria in ulcerative colitis patients of North India. World J Gastroenterol 2013; 19(22): 3404-3414
- URL: https://www.wjgnet.com/1007-9327/full/v19/i22/3404.htm
- DOI: https://dx.doi.org/10.3748/wjg.v19.i22.3404


