Copyright
©2013 Baishideng Publishing Group Co.
World J Gastroenterol. Jun 14, 2013; 19(22): 3404-3414
Published online Jun 14, 2013. doi: 10.3748/wjg.v19.i22.3404
Published online Jun 14, 2013. doi: 10.3748/wjg.v19.i22.3404
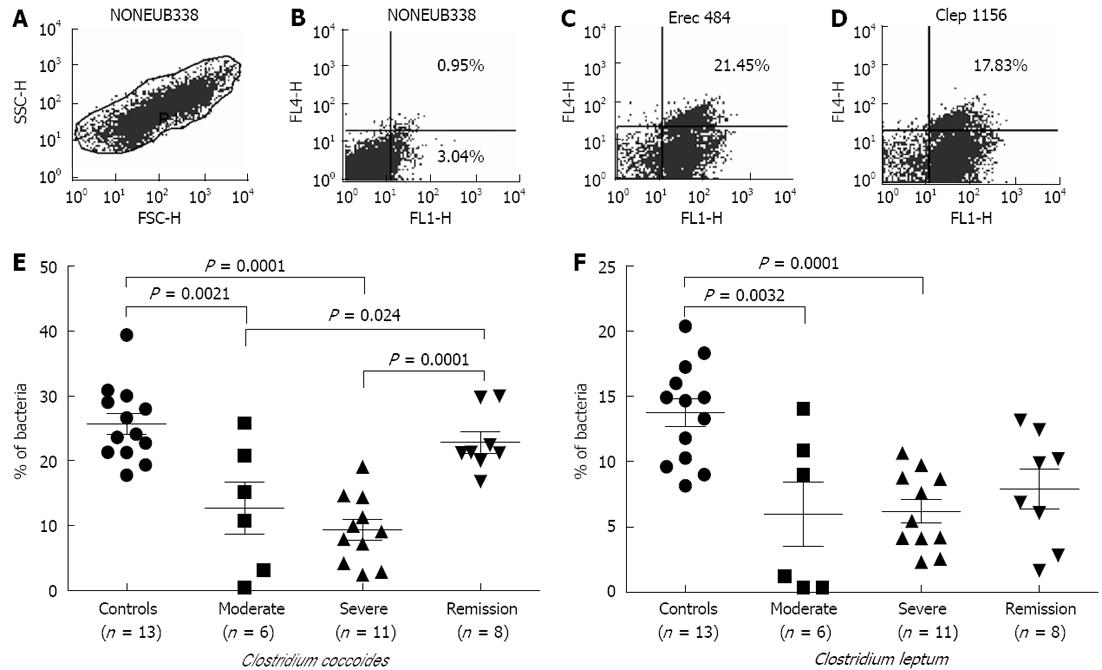
Figure 1 Flow cytometric analysis of fecal microflora using 16S rRNA targeted probes.
A: The region R1 corresponding to relative size (the forward angle light scatter)/granularity (the side angle light scatter) of the bacteria was delineated. This region R1 was gated for further dot plots; B: Bacteria from fecal samples were hybridized with NONEUB338 probe; C: EUB338 and Erec 482; D: EUB338 and Clep 1156. A shift in fluorescence to higher intensities was obtained upon hybridization with positive control or group-specific probe: right lower and upper quadrant compared to the lower left quadrant. The signal in lower left quadrant represents debris. The events in upper right quadrant represent the proportion of bacterial cells hybridized with the group-specific probe within the total bacterial cells hybridized with the universal bacterial probe EUB338-fluorescein isothiocyanate (FITC). The enumeration of targeted cells was corrected by subtracting the background fluorescence, which was measured using the negative control NONEUB338 probe. Fluorescent in situ hybridization (FISH)-flow cytometry data were expressed as the mean % group-specific probe/EUB338 ± SE as enumerated by FISH-flow cytometry in control, moderate, severe and remission samples of ulcerative colitis; E: Erec 482; F: Clep 1156.
- Citation: Kumari R, Ahuja V, Paul J. Fluctuations in butyrate-producing bacteria in ulcerative colitis patients of North India. World J Gastroenterol 2013; 19(22): 3404-3414
- URL: https://www.wjgnet.com/1007-9327/full/v19/i22/3404.htm
- DOI: https://dx.doi.org/10.3748/wjg.v19.i22.3404


