Copyright
©2013 Baishideng Publishing Group Co.
World J Gastroenterol. Jun 7, 2013; 19(21): 3263-3271
Published online Jun 7, 2013. doi: 10.3748/wjg.v19.i21.3263
Published online Jun 7, 2013. doi: 10.3748/wjg.v19.i21.3263
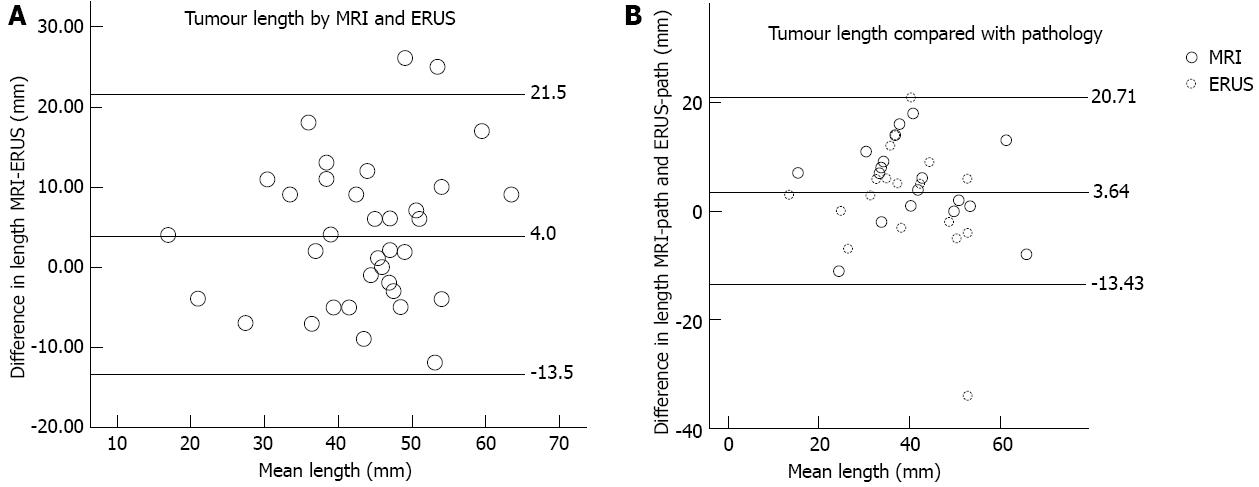
Figure 4 Measurements of supero-inferior length using magnetic resonance imaging and endosonography.
A: 37 pairs of measurements using both methods in the same patients before (19) and after (18) chemotherapy. The Bland-Altman plot illustrates the agreement between the methods. The reference lines are set at the mean difference and plus and minus 1.96 standard deviation from the mean difference; B: Measurements in 18 patients after chemotherapy compared with the resected specimens after fixation. The middle reference line shows the mean of differences in length between magnetic resonance imaging (MRI) and pathology, and endosonography (ERUS) and pathology. The outer lines show plus and minus 1.96 the mean standard deviation from the mean difference.
- Citation: Swartling T, Kälebo P, Derwinger K, Gustavsson B, Kurlberg G. Stage and size using magnetic resonance imaging and endosonography in neoadjuvantly-treated rectal cancer. World J Gastroenterol 2013; 19(21): 3263-3271
- URL: https://www.wjgnet.com/1007-9327/full/v19/i21/3263.htm
- DOI: https://dx.doi.org/10.3748/wjg.v19.i21.3263


