Copyright
©2013 Baishideng Publishing Group Co.
World J Gastroenterol. Jun 7, 2013; 19(21): 3226-3240
Published online Jun 7, 2013. doi: 10.3748/wjg.v19.i21.3226
Published online Jun 7, 2013. doi: 10.3748/wjg.v19.i21.3226
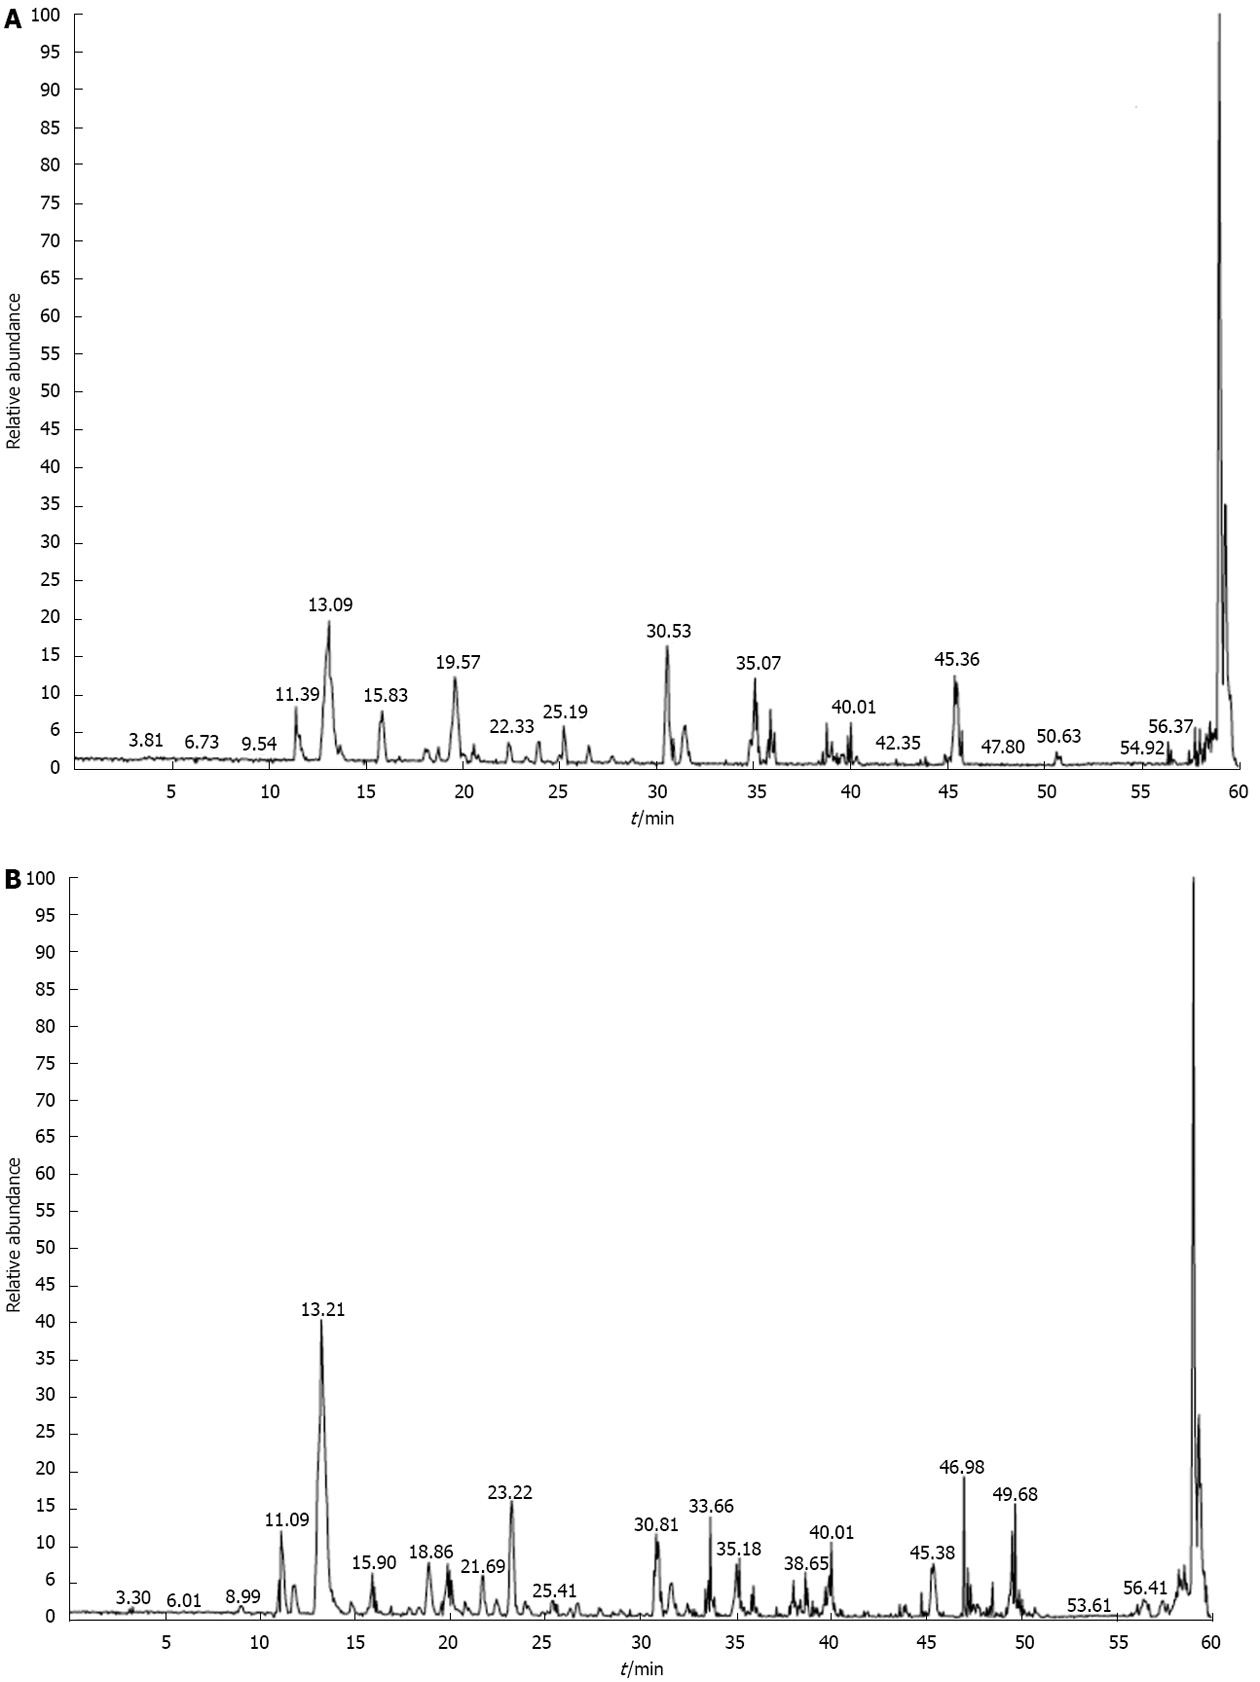
Figure 9 Mass spectrometry total ion chromatography.
A: 72 kDa band of lysine-acetylated protein in AGS cells before trichostatin A (TSA) treatment; B: 28 kDa band of lysine-acetylated protein in AGS cells after TSA treatment.
- Citation: Wang YG, Wang N, Li GM, Fang WL, Wei J, Ma JL, Wang T, Shi M. Mechanisms of trichostatin A inhibiting AGS proliferation and identification of lysine-acetylated proteins. World J Gastroenterol 2013; 19(21): 3226-3240
- URL: https://www.wjgnet.com/1007-9327/full/v19/i21/3226.htm
- DOI: https://dx.doi.org/10.3748/wjg.v19.i21.3226


