Copyright
©2013 Baishideng Publishing Group Co.
World J Gastroenterol. Jun 7, 2013; 19(21): 3226-3240
Published online Jun 7, 2013. doi: 10.3748/wjg.v19.i21.3226
Published online Jun 7, 2013. doi: 10.3748/wjg.v19.i21.3226
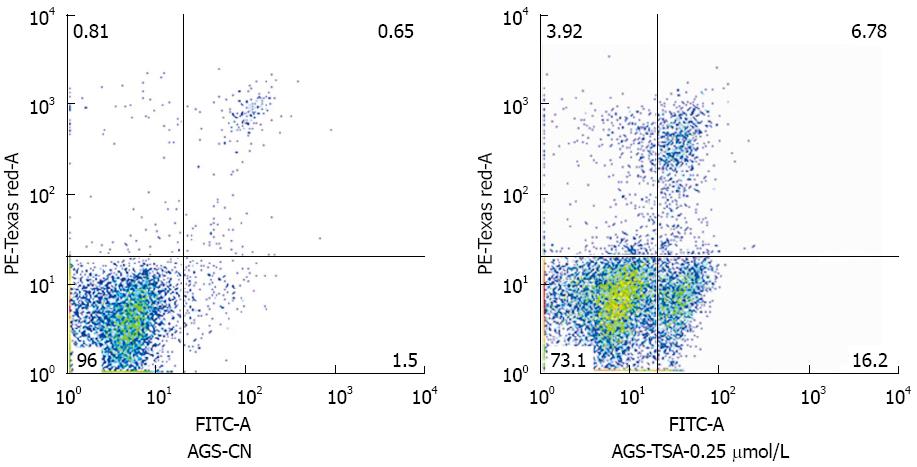
Figure 3 AGS cell apoptosis changes before and after trichostatin A exposure by flow cytometry.
Fluorescence staining was mainly seen in normal areas, but rarely in apoptotic and necrotic areas of unexposed AGS cells; staining appeared in the apoptotic and necrotic areas of AGS cells exposed to 0.25 μmol/L trichostatin A (TSA).
- Citation: Wang YG, Wang N, Li GM, Fang WL, Wei J, Ma JL, Wang T, Shi M. Mechanisms of trichostatin A inhibiting AGS proliferation and identification of lysine-acetylated proteins. World J Gastroenterol 2013; 19(21): 3226-3240
- URL: https://www.wjgnet.com/1007-9327/full/v19/i21/3226.htm
- DOI: https://dx.doi.org/10.3748/wjg.v19.i21.3226


