Copyright
©2013 Baishideng Publishing Group Co.
World J Gastroenterol. Jun 7, 2013; 19(21): 3217-3225
Published online Jun 7, 2013. doi: 10.3748/wjg.v19.i21.3217
Published online Jun 7, 2013. doi: 10.3748/wjg.v19.i21.3217
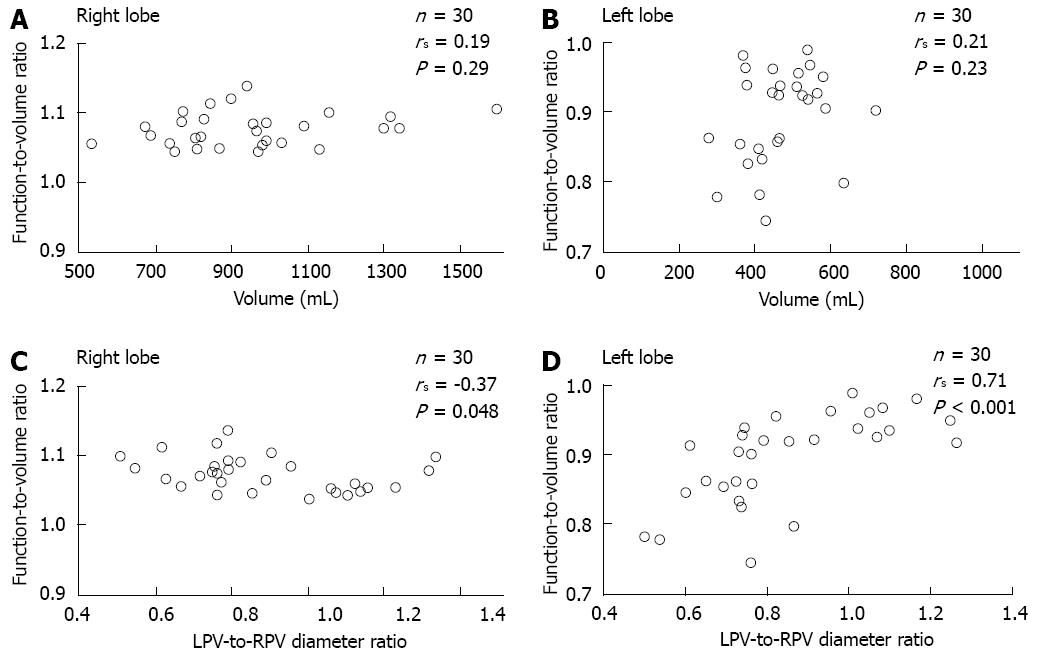
Figure 7 Correlation between the function-to-volume ratio and 2 liver parameters in each lobe.
A and B: The function-to-volume ratio showed no significant correlation with lobe volume in either lobe; C and D: The function-to-volume ratio showed a significant correlation with the ratio of the diameter of the LPV to that of the RPV in both lobes (C: Right lobe, negative correlation; D: Left lobe, positive correlation). LPV: Left portal vein; RPV: Right portal vein.
- Citation: Sumiyoshi T, Shima Y, Tokorodani R, Okabayashi T, Kozuki A, Hata Y, Noda Y, Murata Y, Nakamura T, Uka K. CT/99mTc-GSA SPECT fusion images demonstrate functional differences between the liver lobes. World J Gastroenterol 2013; 19(21): 3217-3225
- URL: https://www.wjgnet.com/1007-9327/full/v19/i21/3217.htm
- DOI: https://dx.doi.org/10.3748/wjg.v19.i21.3217


