Copyright
©2013 Baishideng Publishing Group Co.
World J Gastroenterol. Jun 7, 2013; 19(21): 3217-3225
Published online Jun 7, 2013. doi: 10.3748/wjg.v19.i21.3217
Published online Jun 7, 2013. doi: 10.3748/wjg.v19.i21.3217
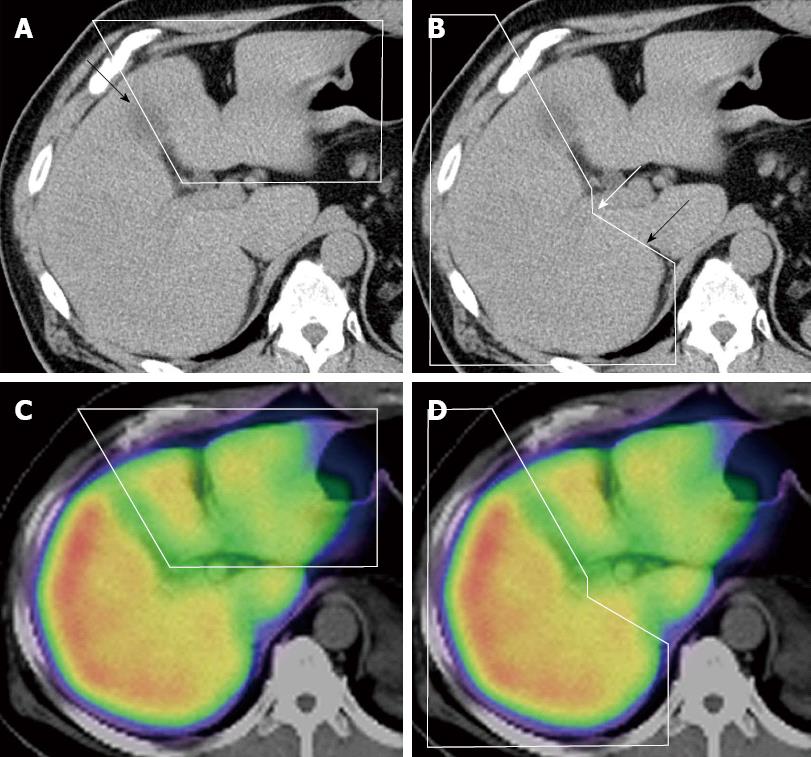
Figure 4 Range of each lobe on the computed tomography and computed tomography/single-photon emission computed tomography fusion image.
A: The extent of the left lobe is manually circled on the non-enhanced computed tomography (CT) image. The arrow shows the gallbladder bed; B: The extent of the right lobe on the non-enhanced CT image. The boundary between the right lobe and the caudate lobe was defined by the line connecting the bifurcation of the right portal vein (white arrow) and the right wall of the inferior vena cava (black arrow); C and D: The extent of each lobe determined from the CT image was automatically projected on the single-photon emission computed tomography/CT fusion image (C: Left lobe; D: Right lobe).
- Citation: Sumiyoshi T, Shima Y, Tokorodani R, Okabayashi T, Kozuki A, Hata Y, Noda Y, Murata Y, Nakamura T, Uka K. CT/99mTc-GSA SPECT fusion images demonstrate functional differences between the liver lobes. World J Gastroenterol 2013; 19(21): 3217-3225
- URL: https://www.wjgnet.com/1007-9327/full/v19/i21/3217.htm
- DOI: https://dx.doi.org/10.3748/wjg.v19.i21.3217


