Copyright
©2013 Baishideng Publishing Group Co.
World J Gastroenterol. May 28, 2013; 19(20): 3090-3095
Published online May 28, 2013. doi: 10.3748/wjg.v19.i20.3090
Published online May 28, 2013. doi: 10.3748/wjg.v19.i20.3090
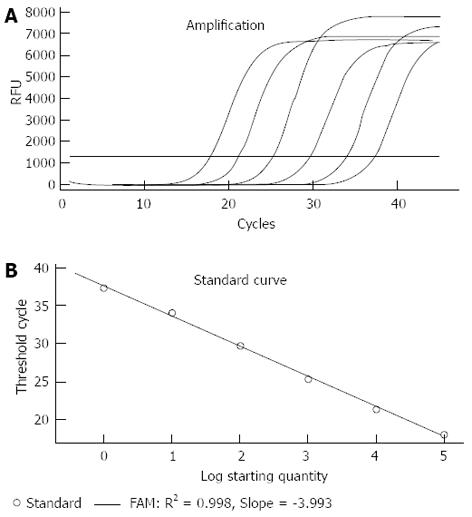
Figure 1 Real time polymerase chain reaction standard curve and the linear relationship between Campylobacter jejuni quantity and polymerase chain reaction cycle threshold.
A: The standard curve was constructed using genomic DNA from Campylobacter jejuni isolates. Serial dilutions ranging from 100 to 106 CFU/mL of target template were subjected to real time polymerase chain reaction assay; B: The linear relationship between Log CFU/mL and threshold cycles. RFU: Relative fluorescence units.
-
Citation: Zhang MJ, Qiao B, Xu XB, Zhang JZ. Development and application of a real-time polymerase chain reaction method for
Campylobacter jejuni detection. World J Gastroenterol 2013; 19(20): 3090-3095 - URL: https://www.wjgnet.com/1007-9327/full/v19/i20/3090.htm
- DOI: https://dx.doi.org/10.3748/wjg.v19.i20.3090


