Copyright
©2013 Baishideng Publishing Group Co.
World J Gastroenterol. Jan 14, 2013; 19(2): 219-226
Published online Jan 14, 2013. doi: 10.3748/wjg.v19.i2.219
Published online Jan 14, 2013. doi: 10.3748/wjg.v19.i2.219
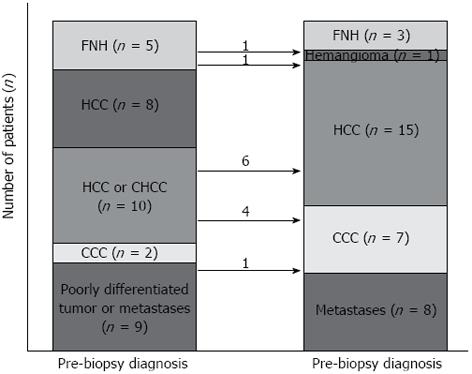
Figure 3 The flow of histological diagnosis.
The values on arrows indicate the number of patients who obtained diagnoses differing from those pre-biopsy diagnoses after liver biopsy.
- Citation: Park H, Park JY, Kim DY, Ahn SH, Chon CY, Han KH, Kim SU. Characterization of focal liver masses using acoustic radiation force impulse elastography. World J Gastroenterol 2013; 19(2): 219-226
- URL: https://www.wjgnet.com/1007-9327/full/v19/i2/219.htm
- DOI: https://dx.doi.org/10.3748/wjg.v19.i2.219


