Copyright
©2013 Baishideng Publishing Group Co.
World J Gastroenterol. May 21, 2013; 19(19): 2913-2920
Published online May 21, 2013. doi: 10.3748/wjg.v19.i19.2913
Published online May 21, 2013. doi: 10.3748/wjg.v19.i19.2913
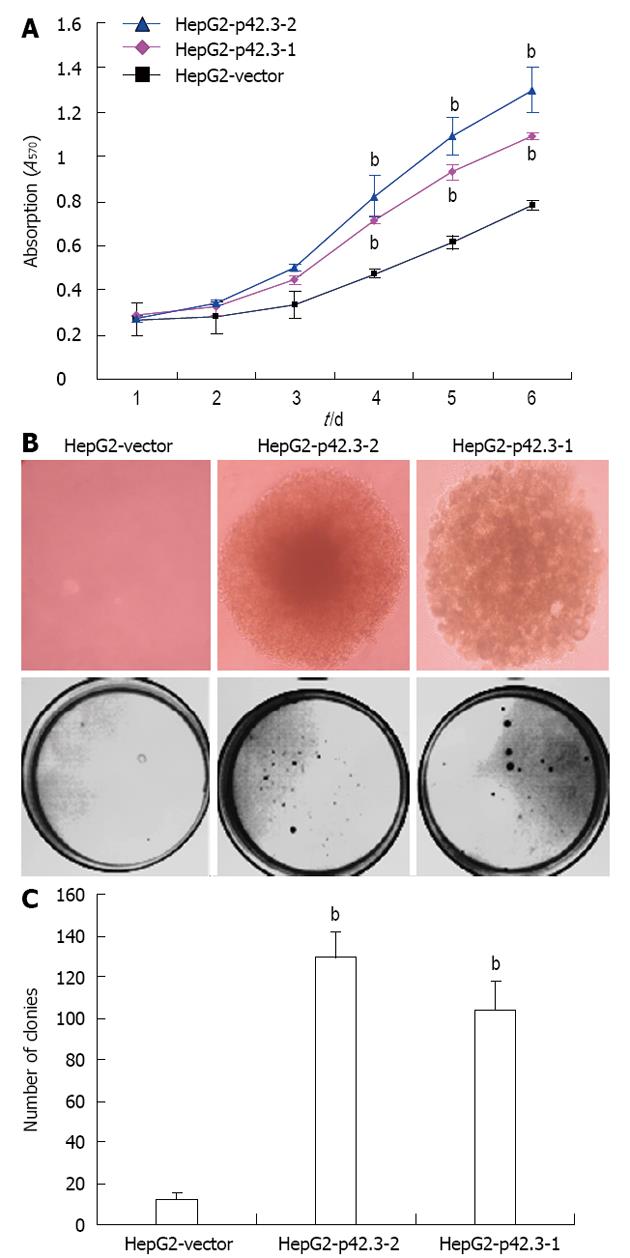
Figure 3 Promotion of cell growth and colony formation with p42.
3 overexpression in HepG2 cells. A: Promotion of cell growth after overexpression of p42.3 in HepG2. Growth curve comparing HepG2-p42.3-1, HepG2-p42.3-2, and HepG2-vector cells over a 6-d time course. Data are shown as the mean ± SD of three independent experiments (bP < 0.01 vs HepG2-p42.3-1); B: The colonies of HepG2-p42.3-1, HepG2-p42.3-2, and HepG2-vector formed on soft agar. The colonies grew faster and were larger in HepG2 cells that overexpressed p42.3-2 than in the HepG2-vector control cells; C: Raw value indicating colony number. Data revealed that the colony-forming activities of HepG2-p42.3-1 and HepG2-p42.3-2 were significantly promoted on soft agar. The data represent the mean ± SD of three independent experiments (bP < 0.01 vs HepG2-vector).
- Citation: Sun W, Dong WW, Mao LL, Li WM, Cui JT, Xing R, Lu YY. Overexpression of p42.3 promotes cell growth and tumorigenicity in hepatocellular carcinoma. World J Gastroenterol 2013; 19(19): 2913-2920
- URL: https://www.wjgnet.com/1007-9327/full/v19/i19/2913.htm
- DOI: https://dx.doi.org/10.3748/wjg.v19.i19.2913


