Copyright
©2013 Baishideng Publishing Group Co.
World J Gastroenterol. Apr 28, 2013; 19(16): 2529-2536
Published online Apr 28, 2013. doi: 10.3748/wjg.v19.i16.2529
Published online Apr 28, 2013. doi: 10.3748/wjg.v19.i16.2529
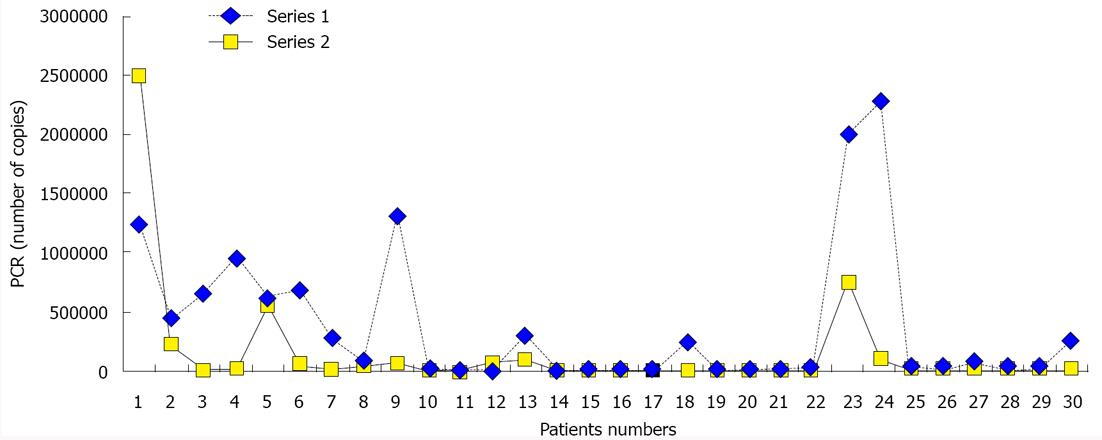
Figure 2 Line plot for polymerase chain reaction levels in individual patients at baseline and after 3 mo of treatment.
Series 1: Polymerase chain reaction (PCR) values in all patients at baseline; Series 2: PCR values in all patients after 3 mo of treatment.
-
Citation: Barakat EMF, El Wakeel LM, Hagag RS. Effects of
Nigella sativa on outcome of hepatitis C in Egypt. World J Gastroenterol 2013; 19(16): 2529-2536 - URL: https://www.wjgnet.com/1007-9327/full/v19/i16/2529.htm
- DOI: https://dx.doi.org/10.3748/wjg.v19.i16.2529


