Copyright
©2013 Baishideng Publishing Group Co.
World J Gastroenterol. Apr 28, 2013; 19(16): 2521-2528
Published online Apr 28, 2013. doi: 10.3748/wjg.v19.i16.2521
Published online Apr 28, 2013. doi: 10.3748/wjg.v19.i16.2521
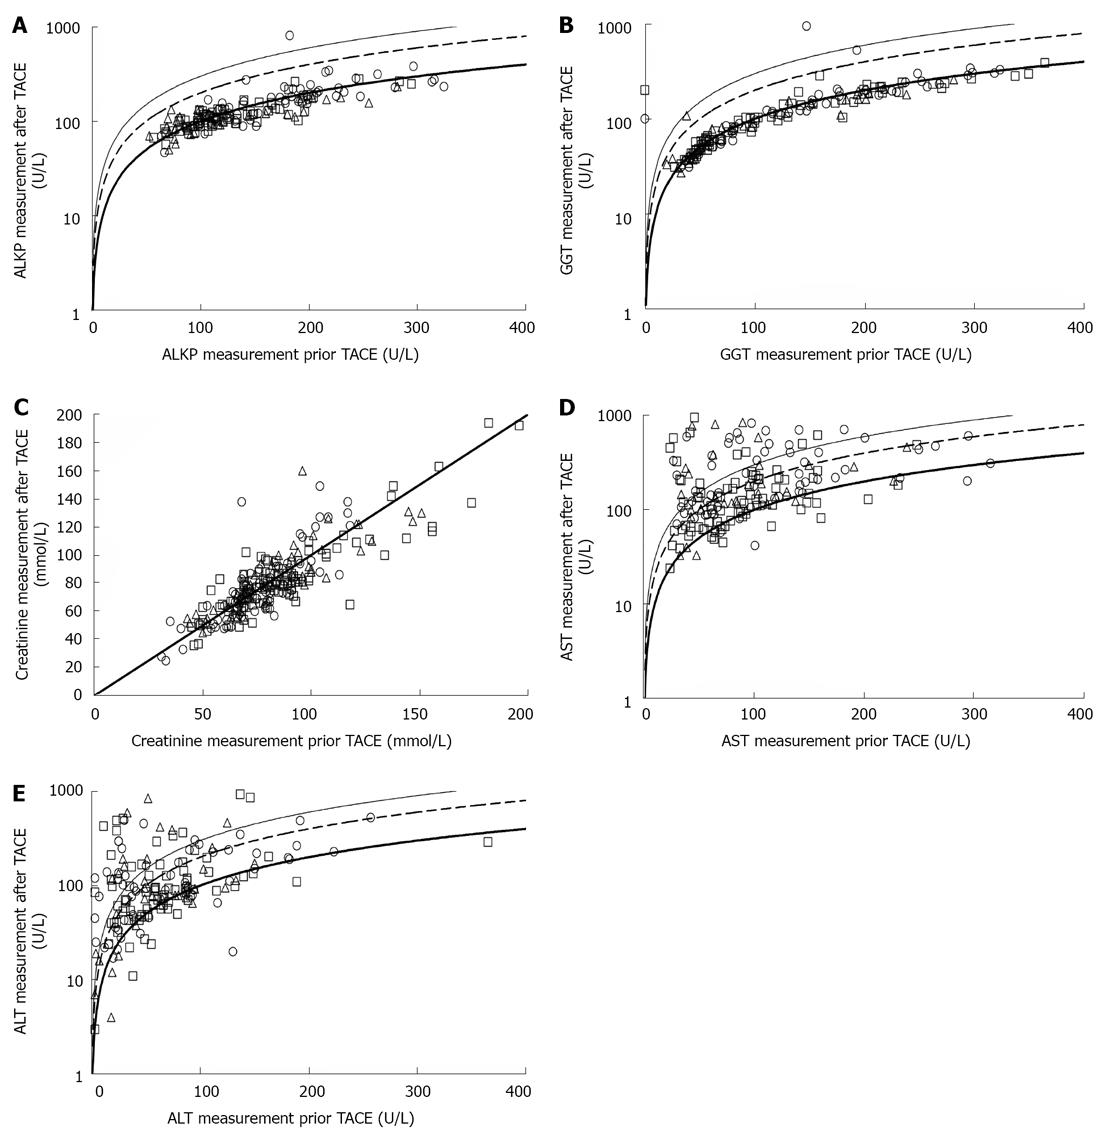
Figure 2 Laboratory results before and after trans-arterial chemoembolization procedures.
A: Alkaline phosphatase (ALKP); B: Gamma-glutamyl transferase (GGT); C: Creatinine; D: Aspartate aminotransferase (AST); E: Alanine aminotransferase (ALT). Values before trans-arterial chemo-embolization (TACE) are in the x-axis, values after TACE are in the y-axis. In panels A, B, D and E, the vertical axis is in a logarithmic scale. In all panels the thick line represents y = x, the dashed line represents y = 2 × x and the thin line represents y = 3 × x. In all panels patients aged < 65 years are represented in circles, patients aged 65-75 years are presented with squares and patients aged ≥ 75 years are represented with triangles.
- Citation: Cohen MJ, Bloom AI, Barak O, Klimov A, Nesher T, Shouval D, Levi I, Shibolet O. Trans-arterial chemo-embolization is safe and effective for very elderly patients with hepatocellular carcinoma. World J Gastroenterol 2013; 19(16): 2521-2528
- URL: https://www.wjgnet.com/1007-9327/full/v19/i16/2521.htm
- DOI: https://dx.doi.org/10.3748/wjg.v19.i16.2521


