Copyright
©2013 Baishideng Publishing Group Co.
World J Gastroenterol. Apr 28, 2013; 19(16): 2492-2500
Published online Apr 28, 2013. doi: 10.3748/wjg.v19.i16.2492
Published online Apr 28, 2013. doi: 10.3748/wjg.v19.i16.2492
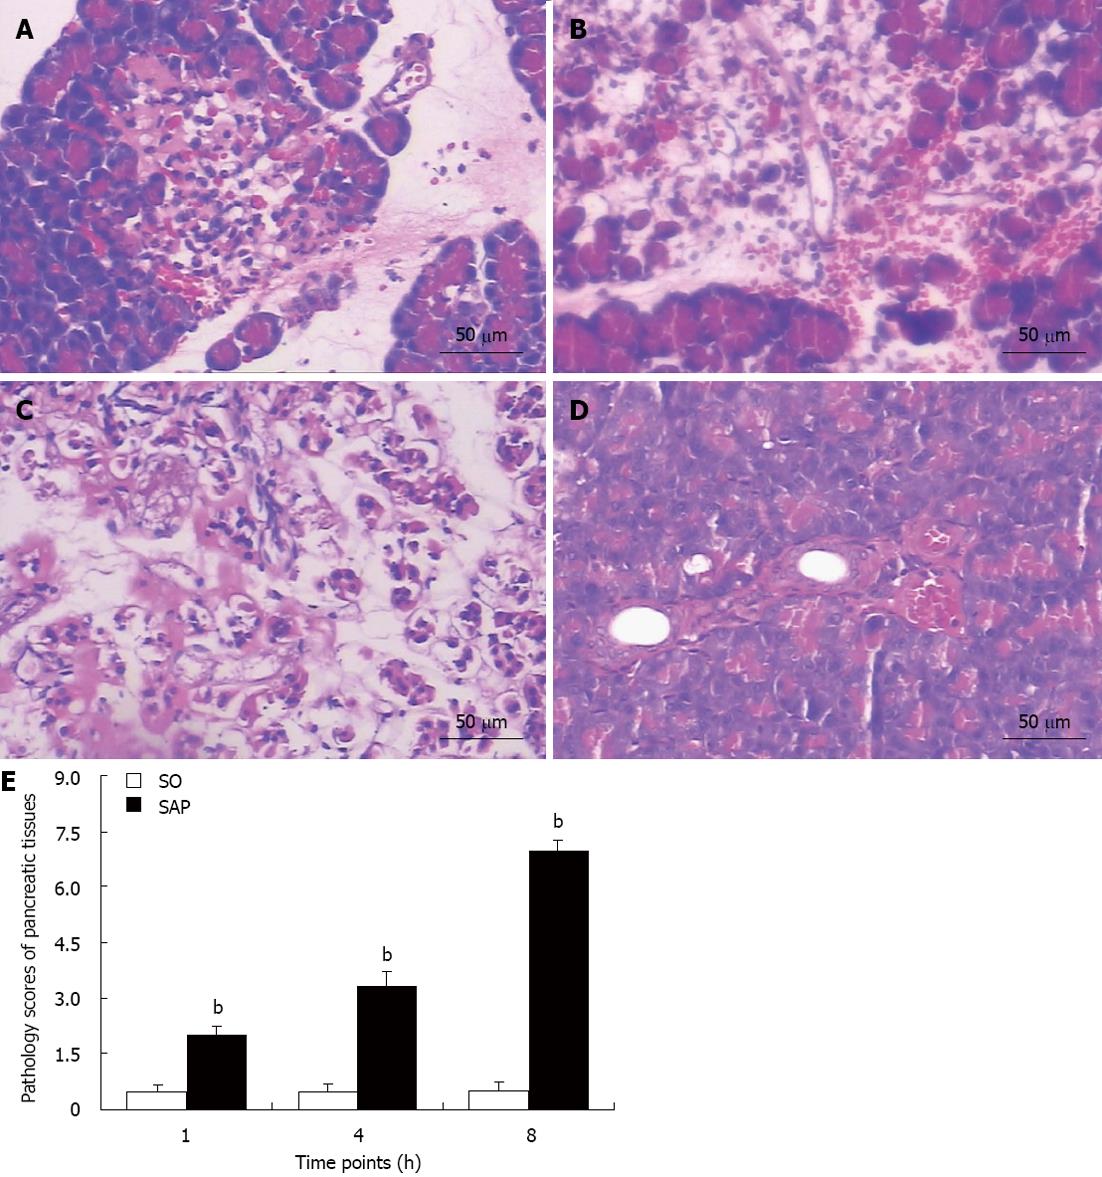
Figure 2 Histology of pancreatic tissues and pathological scores of pancreatic tissues from severe acute pancreatitis and sham-operated rats.
A-C: Histological changes in pancreatic tissues at 1 h (A), 4 h (B), and 8 h (C) in the severe acute pancreatitis (SAP) group; D: Histological changes in pancreatic tissues at 8 h in the sham operation (SO) group (hematoxylin and eosin staining; × 200); E: Pathological scores of pancreatic tissues. Each time point (h) after operation consisted of 8 rats. The data are expressed as the mean ± SD. bP < 0.01 vs SO group.
- Citation: Ye XH, Chen TZ, Huai JP, Lu GR, Zhuge XJ, Chen RP, Chen WJ, Wang C, Huang ZM. Correlation of fibrinogen-like protein 2 with progression of acute pancreatitis in rats. World J Gastroenterol 2013; 19(16): 2492-2500
- URL: https://www.wjgnet.com/1007-9327/full/v19/i16/2492.htm
- DOI: https://dx.doi.org/10.3748/wjg.v19.i16.2492


