Copyright
©2013 Baishideng Publishing Group Co.
World J Gastroenterol. Apr 28, 2013; 19(16): 2481-2491
Published online Apr 28, 2013. doi: 10.3748/wjg.v19.i16.2481
Published online Apr 28, 2013. doi: 10.3748/wjg.v19.i16.2481
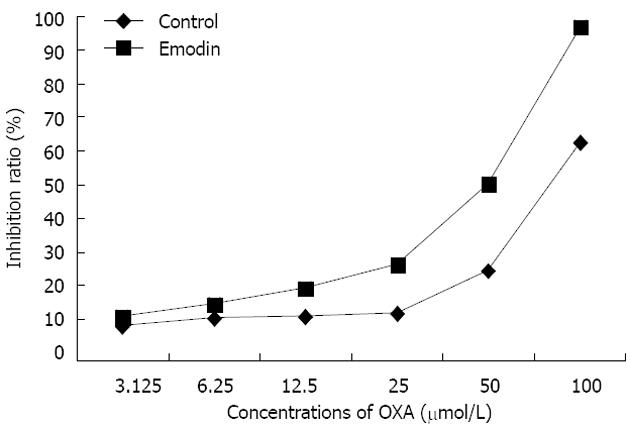
Figure 1 Inhibition ratio of different concentrations (μmol/L) of oxaliplatin in HepG2/oxaliplatin cells.
The value of inhibition ratio increased steadily in the control group and the emodin group, which accompanied the elevated concentration of oxaliplatin (OXA) in the HepG2/OXA cells. However, the value of inhibition ratio in the emodin group treated with 10 μmol/L emodin was significantly higher in comparison with the control group.
- Citation: Chen G, Qiu H, Ke SD, Hu SM, Yu SY, Zou SQ. Emodin regulating excision repair cross-complementation group 1 through fibroblast growth factor receptor 2 signaling. World J Gastroenterol 2013; 19(16): 2481-2491
- URL: https://www.wjgnet.com/1007-9327/full/v19/i16/2481.htm
- DOI: https://dx.doi.org/10.3748/wjg.v19.i16.2481


