Copyright
©2013 Baishideng Publishing Group Co.
World J Gastroenterol. Apr 21, 2013; 19(15): 2340-2347
Published online Apr 21, 2013. doi: 10.3748/wjg.v19.i15.2340
Published online Apr 21, 2013. doi: 10.3748/wjg.v19.i15.2340
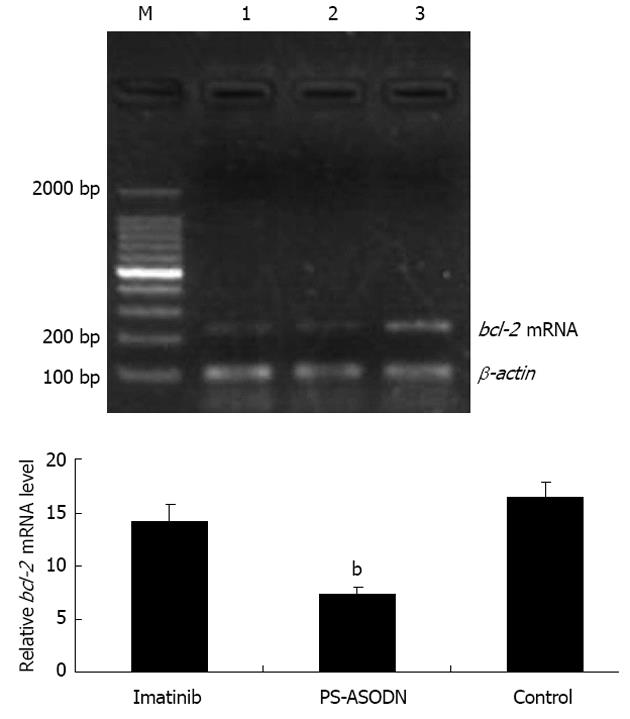
Figure 5 B-cell leukemia/lymphoma 2 mRNA expression in tumor samples as detected by real time-polymerase chain reaction (n = 10 mice per group).
bP < 0.01 vs control and imatinib groups. Each bar represents the mean ± SD. M: Marker, 100-2000 bp; 1: Imatinib-treated group; 2: Phosphorothioate antisense oligodeoxynucleotides (PS-ASODN)-treated group; Lane 3: Control group. bcl-2: B-cell leukemia/lymphoma 2.
- Citation: Sun XC, Yan JY, Chen XL, Huang YP, Shen X, Ye XH. Depletion of telomerase RNA inhibits growth of gastrointestinal tumors transplanted in mice. World J Gastroenterol 2013; 19(15): 2340-2347
- URL: https://www.wjgnet.com/1007-9327/full/v19/i15/2340.htm
- DOI: https://dx.doi.org/10.3748/wjg.v19.i15.2340


