Copyright
©2013 Baishideng Publishing Group Co.
World J Gastroenterol. Apr 14, 2013; 19(14): 2187-2196
Published online Apr 14, 2013. doi: 10.3748/wjg.v19.i14.2187
Published online Apr 14, 2013. doi: 10.3748/wjg.v19.i14.2187
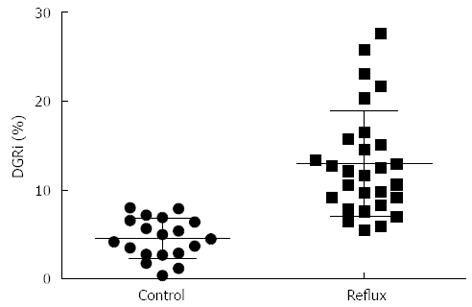
Figure 5 Comparison of duodenogastric reflux group and control group in the scintigraphy.
The reflux rates of duodenogastric reflux group in the patients were higher than those in the control group with statistically significant differences (Z = -5.224, P < 0.001). Data was calculated using the independent-samples Mann-Whitney U-test. DGRi: Duodenogastric reflux index.
- Citation: Chen TF, Yadav PK, Wu RJ, Yu WH, Liu CQ, Lin H, Liu ZJ. Comparative evaluation of intragastric bile acids and hepatobiliary scintigraphy in the diagnosis of duodenogastric reflux. World J Gastroenterol 2013; 19(14): 2187-2196
- URL: https://www.wjgnet.com/1007-9327/full/v19/i14/2187.htm
- DOI: https://dx.doi.org/10.3748/wjg.v19.i14.2187


