Copyright
©2013 Baishideng Publishing Group Co.
World J Gastroenterol. Mar 28, 2013; 19(12): 1877-1889
Published online Mar 28, 2013. doi: 10.3748/wjg.v19.i12.1877
Published online Mar 28, 2013. doi: 10.3748/wjg.v19.i12.1877
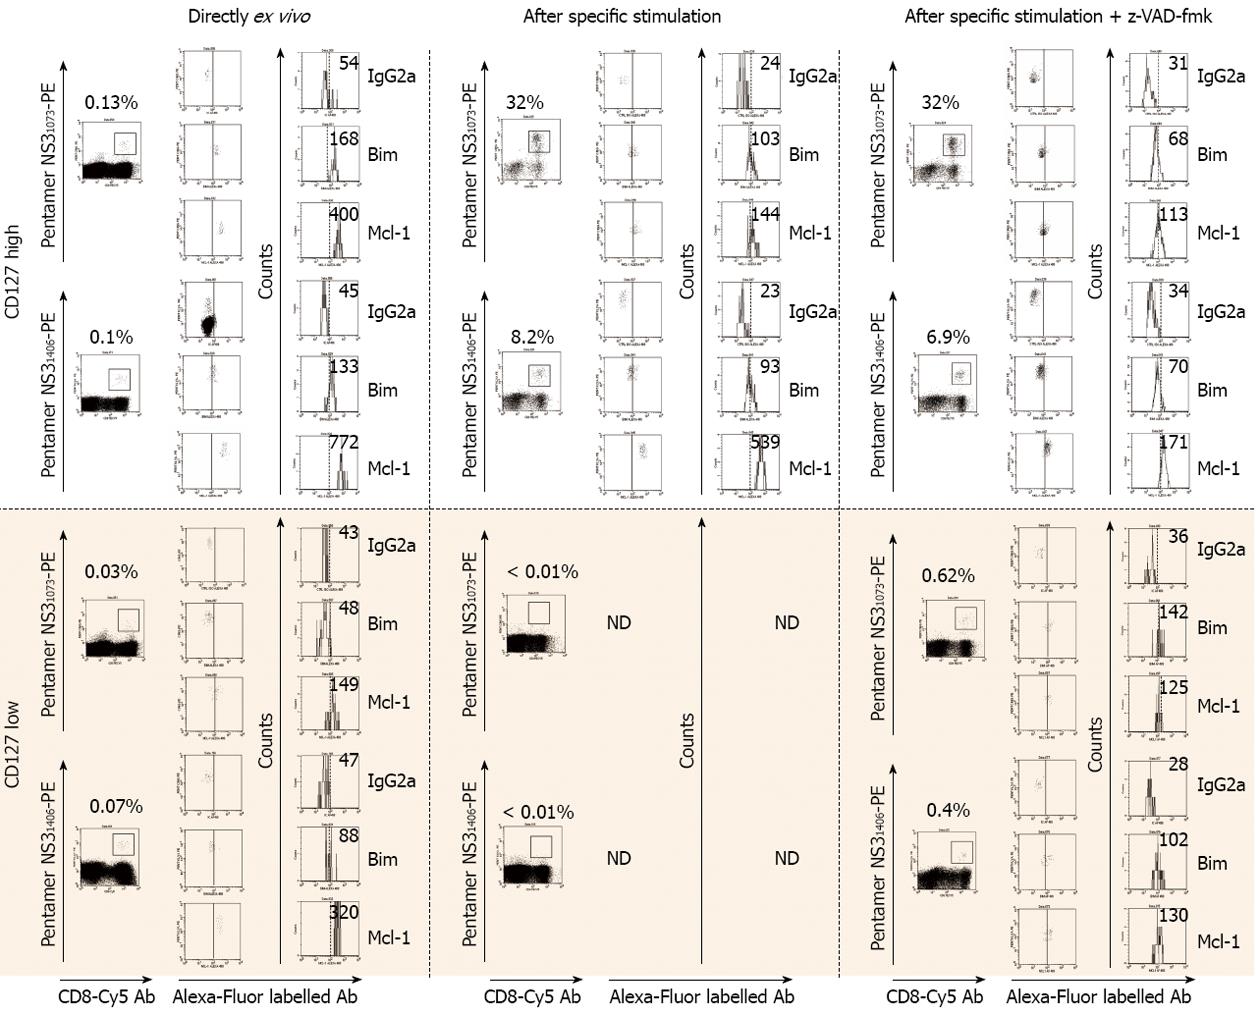
Figure 9 Figure illustrated the FACSan® dot plots and histograms from peripheral blood lymphocytes from two hepatitis C virus patients with different CD127 expression on hepatitis C virus-specific cytotoxic T lymphocytes (CD8+/Pentamer+ cells).
The different plots show the Bcl-2 interacting mediator (Bim) and myeloid cell leukemia sequence-1 (Mcl-1) expression directly ex vivo and after specific stimulation on peripheral CD8+/pentameter+ cells according to CD127 level. The figure on the top of the dot-plots represents the frequency of penatmer+ cells out of total CD8+ cells. The figure in the upper right corner in the histogram plot represents the MFI for Bim and Mcl-1 staining. The continuous and dashed line in the dot-plots and histograms represents the cut-off point to consider a staining positive according to the negative control. ND: Not done due to lack of pentamer+/CD8+ proliferation after specific stimulation.
- Citation: Larrubia JR, Lokhande MU, García-Garzón S, Miquel J, Subirá D, Sanz-de-Villalobos E. Role of T cell death in maintaining immune tolerance during persistent viral hepatitis. World J Gastroenterol 2013; 19(12): 1877-1889
- URL: https://www.wjgnet.com/1007-9327/full/v19/i12/1877.htm
- DOI: https://dx.doi.org/10.3748/wjg.v19.i12.1877


