Copyright
©2013 Baishideng Publishing Group Co.
World J Gastroenterol. Mar 21, 2013; 19(11): 1736-1748
Published online Mar 21, 2013. doi: 10.3748/wjg.v19.i11.1736
Published online Mar 21, 2013. doi: 10.3748/wjg.v19.i11.1736
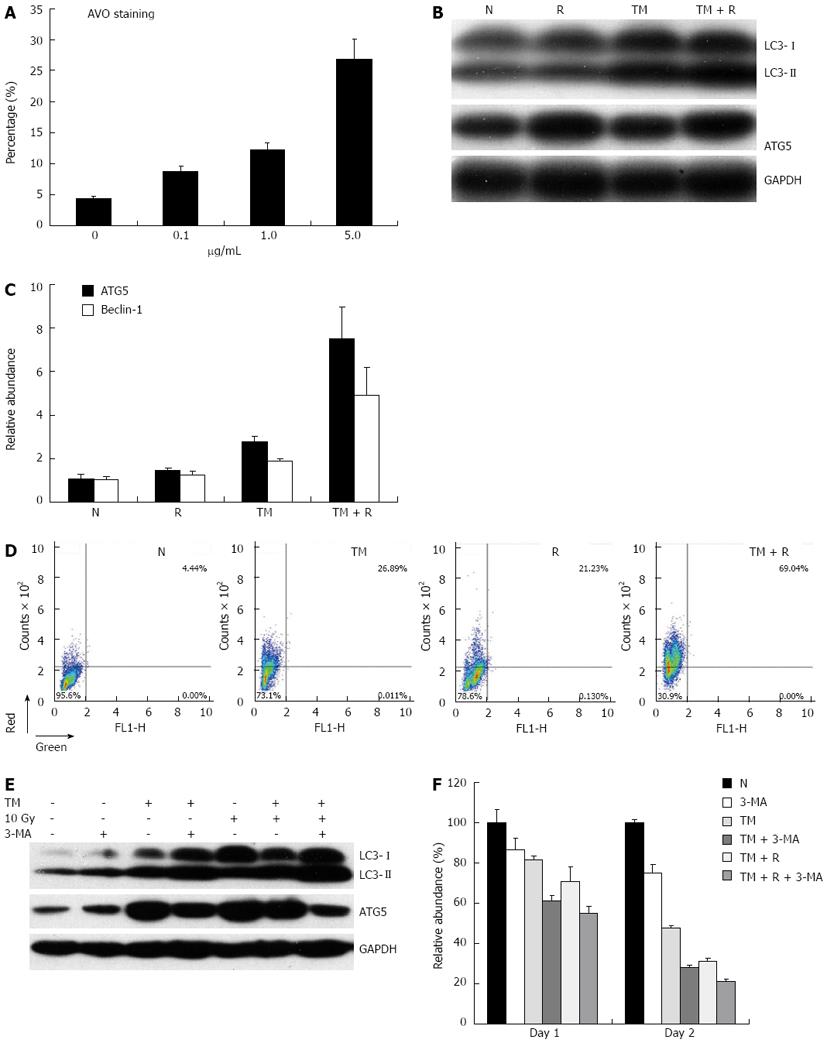
Figure 4 Autophagy response induced by tunicamycin.
A: EC109 cells were exposed to increasing concentrations of tunicamycin (TM), and stained with acridine orange (AO); B: EC109 cells were pretreated with or without TM (5 μg/mL), followed by a single dose of 10 Gy and analyzed by Western blotting for LC3 and ATG5; C: Relative mRNA expression of Beclin-1 and ATG5 was assessed by quantitative polymerase chain reaction; D: After AO staining, cells were quantitatively analyzed on a FACSort; E: Cells were treated as indicated, and protein levels of LC3 and ATG5 were assessed by Western blotting; F: Relative cell viability of cells treated with TM, radiation and autophagy inhibitor 3-MA for 24 or 48 h. N: Sham-treated with TM; R: 10 Gy irradiation. GAPDH: Glyceraldehyde-3-phosphate dehydrogenase.
- Citation: Pang XL, He G, Liu YB, Wang Y, Zhang B. Endoplasmic reticulum stress sensitizes human esophageal cancer cell to radiation. World J Gastroenterol 2013; 19(11): 1736-1748
- URL: https://www.wjgnet.com/1007-9327/full/v19/i11/1736.htm
- DOI: https://dx.doi.org/10.3748/wjg.v19.i11.1736


