Copyright
©2013 Baishideng Publishing Group Co.
World J Gastroenterol. Mar 14, 2013; 19(10): 1593-1601
Published online Mar 14, 2013. doi: 10.3748/wjg.v19.i10.1593
Published online Mar 14, 2013. doi: 10.3748/wjg.v19.i10.1593
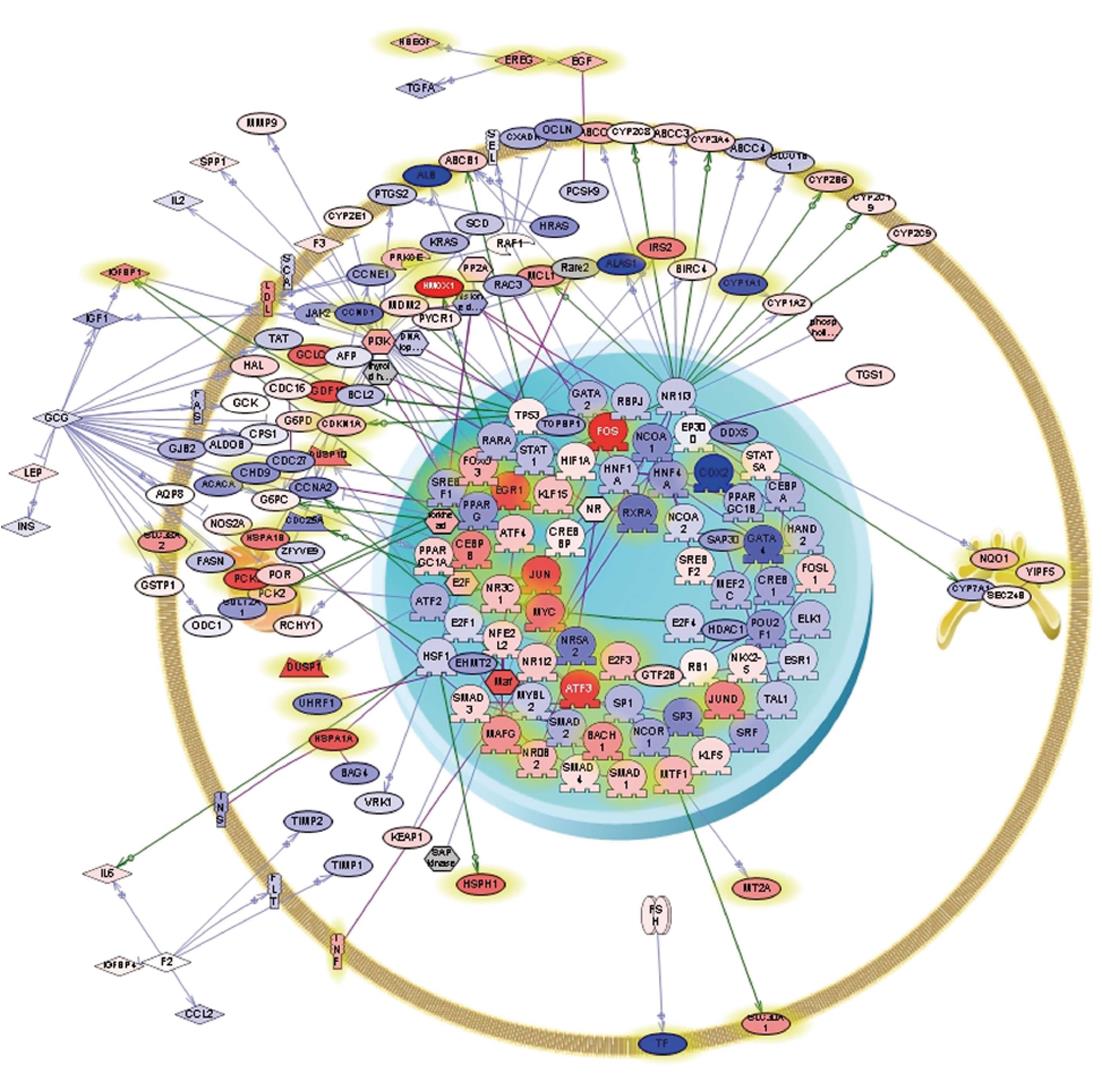
Figure 2 Pathway analysis illustrating differential gene expression in iron protoporphyrin- vs 4, 6-dioxoheptanoic acid- treated Huh-7 cells.
Cells were cultured and exposed to iron protoporphyrin (10 μmol/L) or 4, 6-dioxoheptanoic acid (500 μmol/L) for 6 h, after which they were harvested and total RNA isolated using TRIzol. Pathway analysis was performed using Ariadne Pathway Studio by defining sub-networks of genes selected using gene set enrichment analysis (P≤ 0.01). The resulting sub-networks were combined. Entities satisfying the filtering criteria are depicted. The intensity of red or blue of the entities themselves indicates the corresponding degree of up- or down-regulation, respectively. Differing shapes are used to represent the entity types and the relationships among them.
- Citation: Bonkovsky HL, Hou W, Steuerwald N, Tian Q, Li T, Parsons J, Hamilton A, Hwang S, Schrum L. Heme status affects human hepatic messenger RNA and microRNA expression. World J Gastroenterol 2013; 19(10): 1593-1601
- URL: https://www.wjgnet.com/1007-9327/full/v19/i10/1593.htm
- DOI: https://dx.doi.org/10.3748/wjg.v19.i10.1593


