Copyright
©2013 Baishideng Publishing Group Co.
World J Gastroenterol. Mar 14, 2013; 19(10): 1572-1581
Published online Mar 14, 2013. doi: 10.3748/wjg.v19.i10.1572
Published online Mar 14, 2013. doi: 10.3748/wjg.v19.i10.1572
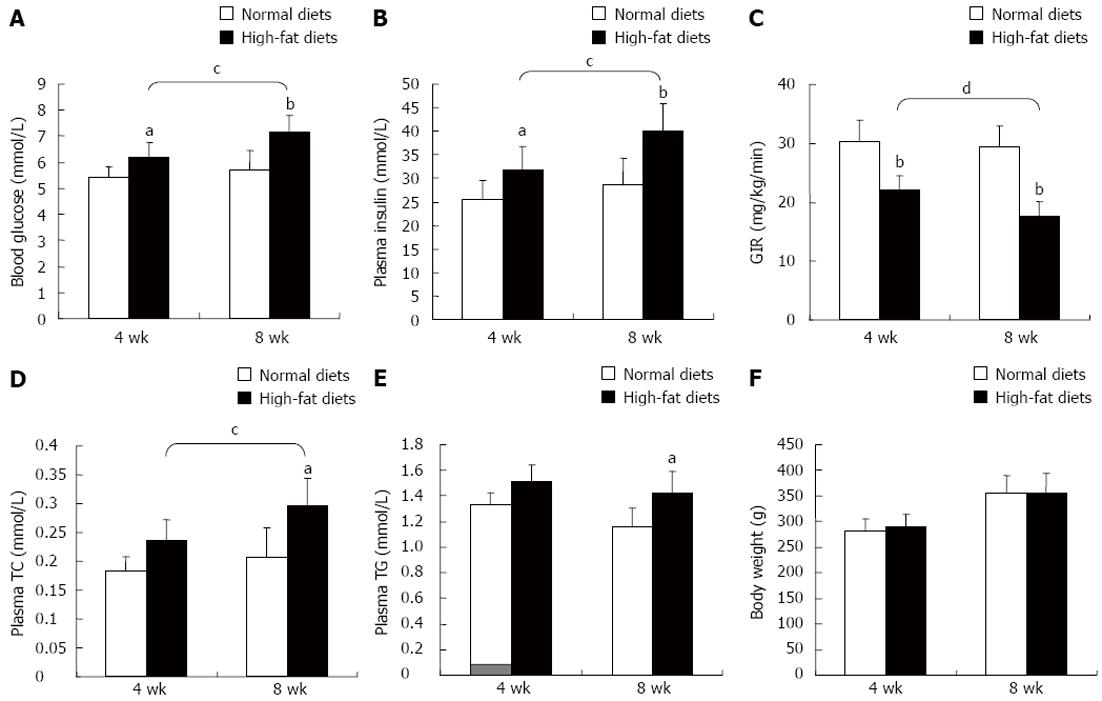
Figure 2 High-fat diets resulted in insulin resistance in rats (n = 6).
Rats were fed with high-fat diets or normal control diets for 4 wk or 8 wk. A: The level of blood glucose; B: The level of plasma insulin. C: The values of glucose infusion rate (GIR) were used to assess insulin sensitivity of rats assayed by hyperinsulinemic euglycemic clamping; D: The level of plasma total cholesterol (TC); E: The level of plasma triglyceride (TG); F: The body weight. aP < 0.05, bP < 0.01 vs normal diets; cP < 0.05, dP < 0.01 vs 4 wk.
- Citation: Gan KX, Wang C, Chen JH, Zhu CJ, Song GY. Mitofusin-2 ameliorates high-fat diet-induced insulin resistance in liver of rats. World J Gastroenterol 2013; 19(10): 1572-1581
- URL: https://www.wjgnet.com/1007-9327/full/v19/i10/1572.htm
- DOI: https://dx.doi.org/10.3748/wjg.v19.i10.1572


