Copyright
©2013 Baishideng Publishing Group Co.
World J Gastroenterol. Mar 14, 2013; 19(10): 1563-1571
Published online Mar 14, 2013. doi: 10.3748/wjg.v19.i10.1563
Published online Mar 14, 2013. doi: 10.3748/wjg.v19.i10.1563
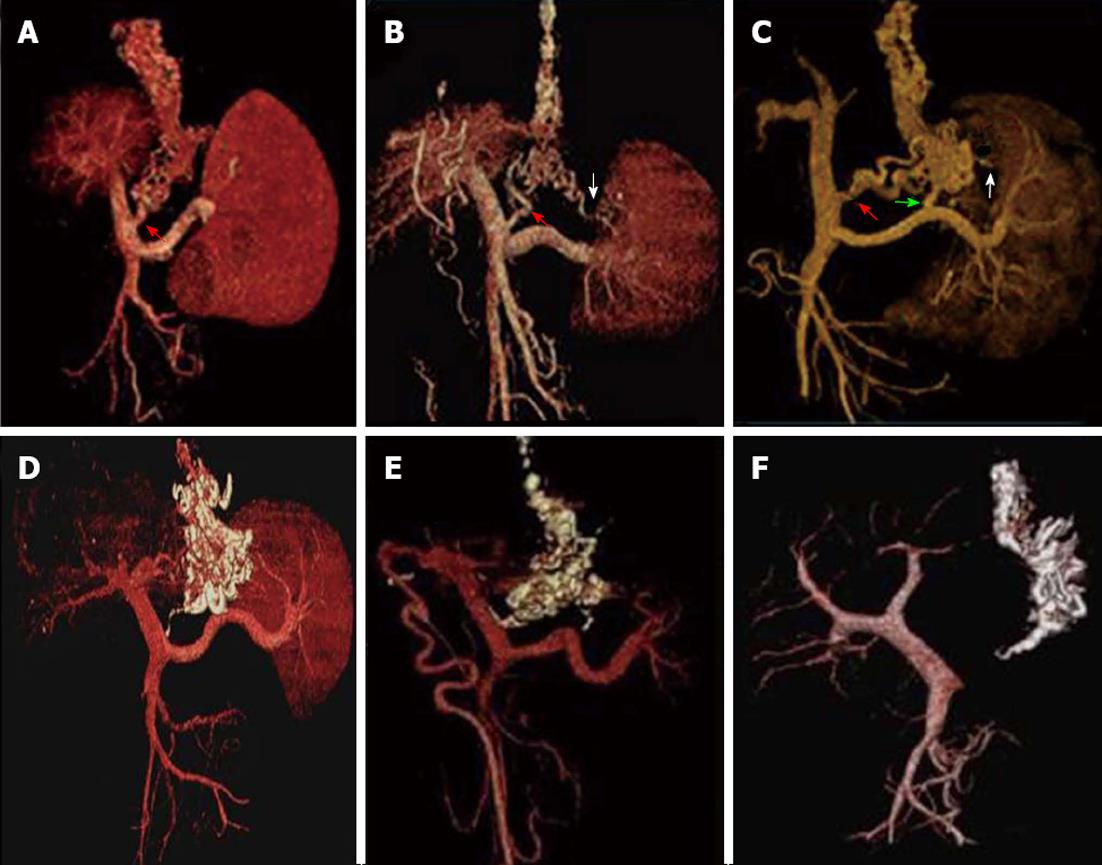
Figure 2 Volume rendering of the multi-detector row computed tomography angiography data set during the portal venous phase demonstrated the esophageal-gastric varices and their afferent vessels before and after percutaneous transhepatic variceal embolization.
A-C: Volume rendering of multi-detector row computed tomography angiography data set during the portal venous phase demonstrates the esophageal-gastric varices and their afferent vessels (left gastric vein (LGV) only for A, LGV and short gastric vein (SGV) for B, LGV, posterior gastric vein and SGV for C); D-F: All varices and their feeding vessels are completely filled with cyanoacrylate (arrows) after percutaneous transhepatic variceal embolization; no flow signals were revealed in any of the cases.
- Citation: Sun A, Shi YJ, Xu ZD, Tian XG, Hu JH, Wang GC, Zhang CQ. MDCT angiography to evaluate the therapeutic effect of PTVE for esophageal varices. World J Gastroenterol 2013; 19(10): 1563-1571
- URL: https://www.wjgnet.com/1007-9327/full/v19/i10/1563.htm
- DOI: https://dx.doi.org/10.3748/wjg.v19.i10.1563


