Copyright
©2013 Baishideng Publishing Group Co.
World J Gastroenterol. Jan 7, 2013; 19(1): 92-96
Published online Jan 7, 2013. doi: 10.3748/wjg.v19.i1.92
Published online Jan 7, 2013. doi: 10.3748/wjg.v19.i1.92
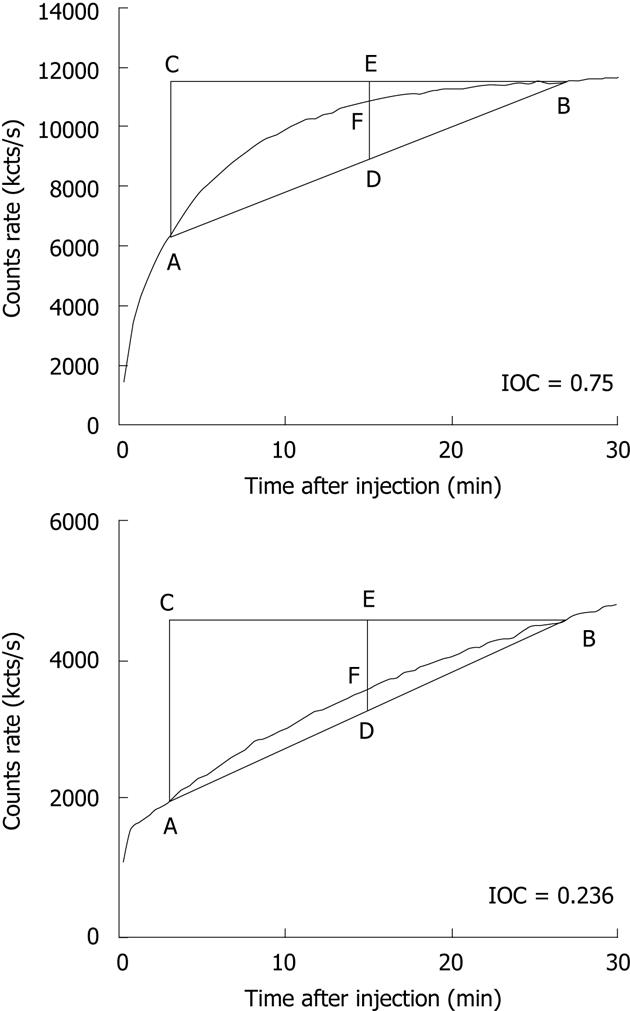
Figure 1 Representative time activity curves of a liver with good function (top) and poor function (bottom).
ΔABC was drawn over the liver curve between the data points at 3 min and 27 min. D, E: The midpoints of lines AB and BC, respectively; F: The intersection of arc AB and line DE. The ratio of the length of DF to the length of DE is defined as index of convexity (IOC). High IOC values indicate good liver function.
- Citation: Miki K, Matsui Y, Teruya M, Kaminishi M, Kokudo N. Index of convexity: A novel liver function index using Tc-GSA scintigraphy. World J Gastroenterol 2013; 19(1): 92-96
- URL: https://www.wjgnet.com/1007-9327/full/v19/i1/92.htm
- DOI: https://dx.doi.org/10.3748/wjg.v19.i1.92


