Copyright
©2012 Baishideng Publishing Group Co.
World J Gastroenterol. Mar 7, 2012; 18(9): 979-985
Published online Mar 7, 2012. doi: 10.3748/wjg.v18.i9.979
Published online Mar 7, 2012. doi: 10.3748/wjg.v18.i9.979
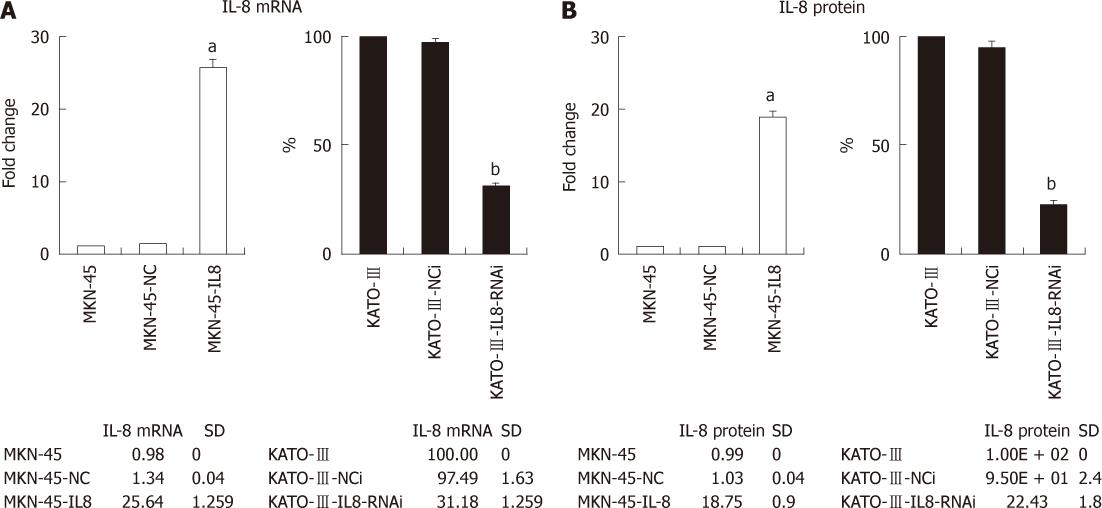
Figure 1 Interleukin-8 expression of gastric cancer cells.
A: Real-time polymerase chain reaction determined the level of Interleukin-8 (IL-8) mRNA in gastric cancer (GC) cells. Expression levels were determined by the ΔΔCt method using glyceraldehyde-3-phosphate dehydrogenase as endogenous control. Histograms show fold change over the relative expression levels of IL-8 mRNA of control cells. Each bar represents the mean ± SD (aP < 0.05 vs MKN-45, bP < 0.05 vs KATO-III); B: IL-8 production in GC cells measured by enzyme-linked immunosorbent assay. Histograms show fold change in the relative expression levels of IL-8 protein of control cells. All experiments were repeated three times with similar results. Each bar represents the mean ± SD (aP < 0.05 vs MKN-45, bP < 0.05 vs KATO-III).
- Citation: Kuai WX, Wang Q, Yang XZ, Zhao Y, Yu R, Tang XJ. Interleukin-8 associates with adhesion, migration, invasion and chemosensitivity of human gastric cancer cells. World J Gastroenterol 2012; 18(9): 979-985
- URL: https://www.wjgnet.com/1007-9327/full/v18/i9/979.htm
- DOI: https://dx.doi.org/10.3748/wjg.v18.i9.979


