Copyright
©2012 Baishideng Publishing Group Co.
World J Gastroenterol. Mar 7, 2012; 18(9): 938-943
Published online Mar 7, 2012. doi: 10.3748/wjg.v18.i9.938
Published online Mar 7, 2012. doi: 10.3748/wjg.v18.i9.938
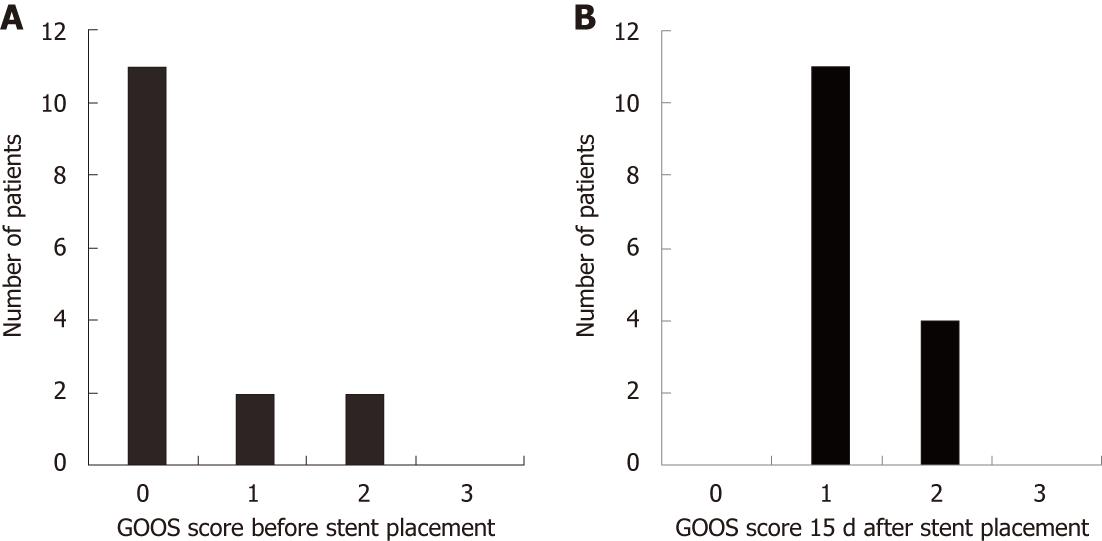
Figure 3 Bar graphs showing the gastric outlet obstruction scores.
A: Before stent placement; B: 15 d after stent placement.
- Citation: Moura EGH, Ferreira FC, Cheng S, Moura DTH, Sakai P, Zilberstain B. Duodenal stenting for malignant gastric outlet obstruction: Prospective study. World J Gastroenterol 2012; 18(9): 938-943
- URL: https://www.wjgnet.com/1007-9327/full/v18/i9/938.htm
- DOI: https://dx.doi.org/10.3748/wjg.v18.i9.938


