Copyright
©2012 Baishideng Publishing Group Co.
World J Gastroenterol. Mar 7, 2012; 18(9): 915-922
Published online Mar 7, 2012. doi: 10.3748/wjg.v18.i9.915
Published online Mar 7, 2012. doi: 10.3748/wjg.v18.i9.915
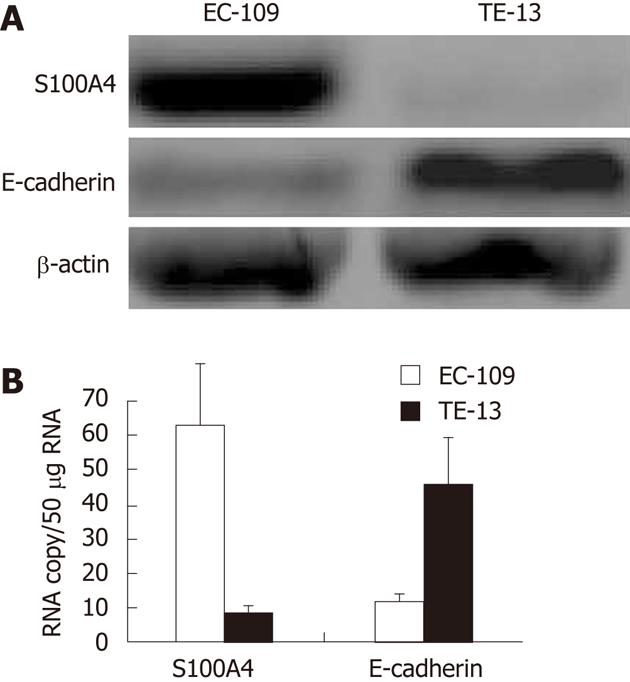
Figure 2 Analysis for S100A4 and E-cadherin in EC109 and TE13 cell lines.
A: Western blotting analysis for S100A4 and E-cadherin in EC109 and TE13 cell lines; B: Reverse transcription-polymerase chain reaction analysis for S100A4 and E-cadherin in EC109 and TE13 cell lines. The levels of S100A4 were significantly higher in EC109 cells than that of in TE13 cells, and the levels of E-cadherin were significantly lower in EC109 cells than that of in TE13 cells.
- Citation: Chen D, Zheng XF, Yang ZY, Liu DX, Zhang GY, Jiao XL, Zhao H. S100A4 silencing blocks invasive ability of esophageal squamous cell carcinoma cells. World J Gastroenterol 2012; 18(9): 915-922
- URL: https://www.wjgnet.com/1007-9327/full/v18/i9/915.htm
- DOI: https://dx.doi.org/10.3748/wjg.v18.i9.915


