Copyright
©2012 Baishideng Publishing Group Co.
World J Gastroenterol. Mar 7, 2012; 18(9): 889-895
Published online Mar 7, 2012. doi: 10.3748/wjg.v18.i9.889
Published online Mar 7, 2012. doi: 10.3748/wjg.v18.i9.889
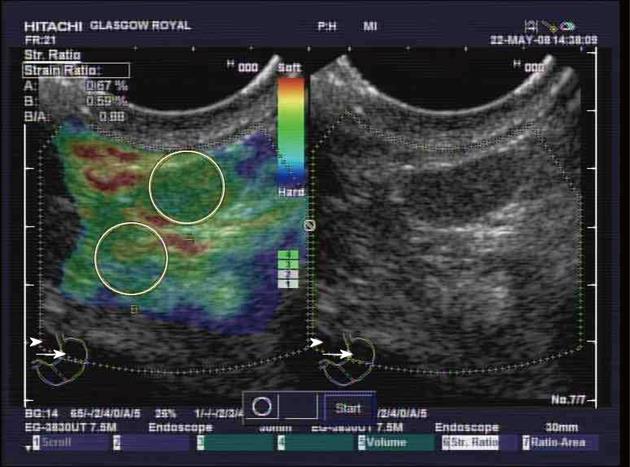
Figure 2 Endoscopic ultrasound elastography of a benign lymph node.
The right-hand side of the image displays standard grey-scale endoscopic ultrasound images while on the left is a superimposed elastography image. In the elastography image window the strain ratio measurements of the two areas outlined in the yellow circles is shown as a percentage in the top left-hand corner. The calculated strain ratio is shown as B/A. The elastographic signal is indicated by the bar column in the bottom right of the elastographic image window.
- Citation: Paterson S, Duthie F, Stanley AJ. Endoscopic ultrasound-guided elastography in the nodal staging of oesophageal cancer. World J Gastroenterol 2012; 18(9): 889-895
- URL: https://www.wjgnet.com/1007-9327/full/v18/i9/889.htm
- DOI: https://dx.doi.org/10.3748/wjg.v18.i9.889


