Copyright
©2012 Baishideng Publishing Group Co.
World J Gastroenterol. Feb 21, 2012; 18(7): 627-636
Published online Feb 21, 2012. doi: 10.3748/wjg.v18.i7.627
Published online Feb 21, 2012. doi: 10.3748/wjg.v18.i7.627
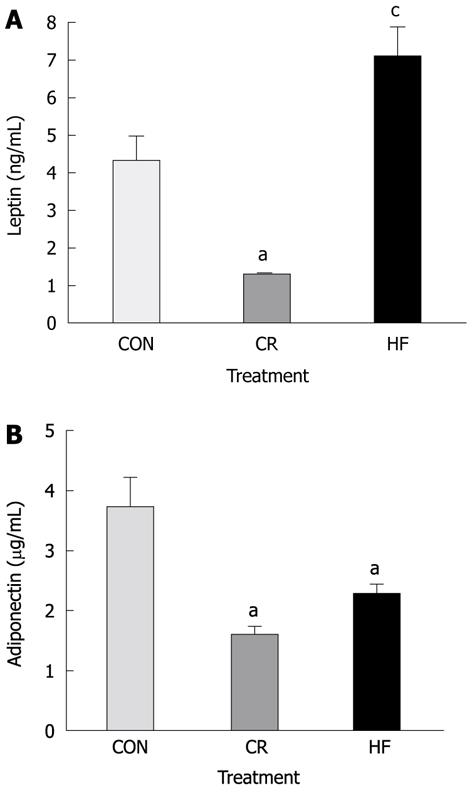
Figure 1 Plasma adipokines in SMAD3-/- mice after 20 wk on dietary treatment.
A: Average plasma concentrations of leptin between diet groups prior to infection. Calorie restricted (CR) mice had significantly lower concentrations, whereas high fat (HF) mice had significantly higher concentrations of leptin compared to control (CON) mice (P < 0.01); B: Average plasma concentrations of adiponectin between diets prior to infection. Both CR and HF diet mice had significantly lower concentrations of adiponectin than mice on CON diet (P < 0.05). aP < 0.05 vs control; cP < 0.05 vs all other groups.
- Citation: McCaskey SJ, Rondini EA, Langohr IM, Fenton JI. Differential effects of energy balance on experimentally-induced colitis. World J Gastroenterol 2012; 18(7): 627-636
- URL: https://www.wjgnet.com/1007-9327/full/v18/i7/627.htm
- DOI: https://dx.doi.org/10.3748/wjg.v18.i7.627


