Copyright
©2012 Baishideng Publishing Group Co.
World J Gastroenterol. Feb 14, 2012; 18(6): 541-545
Published online Feb 14, 2012. doi: 10.3748/wjg.v18.i6.541
Published online Feb 14, 2012. doi: 10.3748/wjg.v18.i6.541
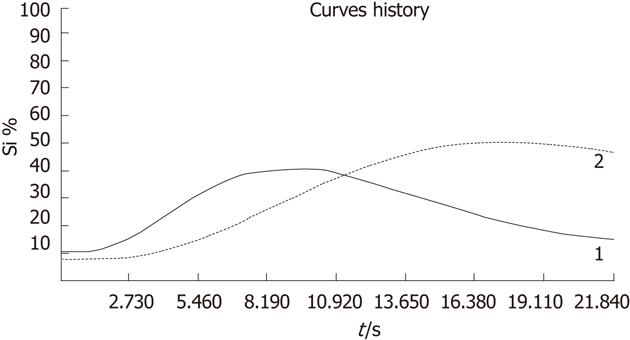
Figure 2 Curves of contrast behavior in a liver metastasis (solid line, 1) and normal liver tissue (dotted line, 2) over the time (s = seconds) and percent of contrast enhancement (Si %).
- Citation: Schirin-Sokhan R, Winograd R, Roderburg C, Bubenzer J, Ó NCD, Guggenberger D, Hecker H, Trautwein C, Tischendorf JJW. Response evaluation of chemotherapy in metastatic colorectal cancer by contrast enhanced ultrasound. World J Gastroenterol 2012; 18(6): 541-545
- URL: https://www.wjgnet.com/1007-9327/full/v18/i6/541.htm
- DOI: https://dx.doi.org/10.3748/wjg.v18.i6.541


