Copyright
©2012 Baishideng Publishing Group Co.
World J Gastroenterol. Dec 28, 2012; 18(48): 7348-7356
Published online Dec 28, 2012. doi: 10.3748/wjg.v18.i48.7348
Published online Dec 28, 2012. doi: 10.3748/wjg.v18.i48.7348
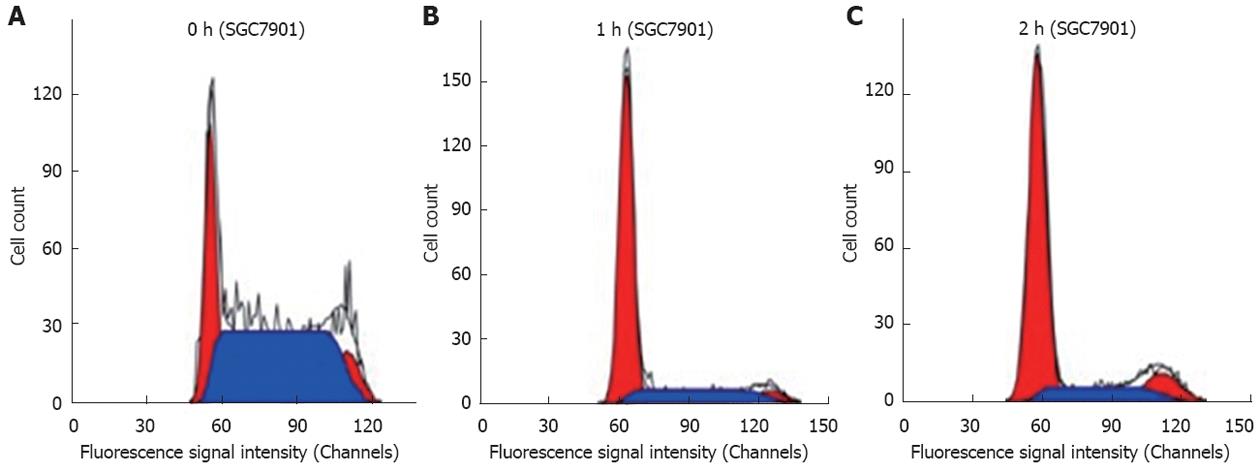
Figure 1 Cell cycle change in SGC-7901 cells following thermotherapy for various time periods.
A-C: Cell cycle distribution in SGC-7901 cells following thermotherapy for 0 h, 1 h, 2 h respectively. Thermotherapy increased the number of SGC-790l cells in G0/G1 phase, but reduced the number in S phase (P < 0.05) at 1 h and 2 h, compared with that at 0 h.
- Citation: Xiao F, Liu B, Zhu QX. c-Jun N-terminal kinase is required for thermotherapy-induced apoptosis in human gastric cancer cells. World J Gastroenterol 2012; 18(48): 7348-7356
- URL: https://www.wjgnet.com/1007-9327/full/v18/i48/7348.htm
- DOI: https://dx.doi.org/10.3748/wjg.v18.i48.7348


