Copyright
©2012 Baishideng Publishing Group Co.
World J Gastroenterol. Dec 28, 2012; 18(48): 7271-7278
Published online Dec 28, 2012. doi: 10.3748/wjg.v18.i48.7271
Published online Dec 28, 2012. doi: 10.3748/wjg.v18.i48.7271
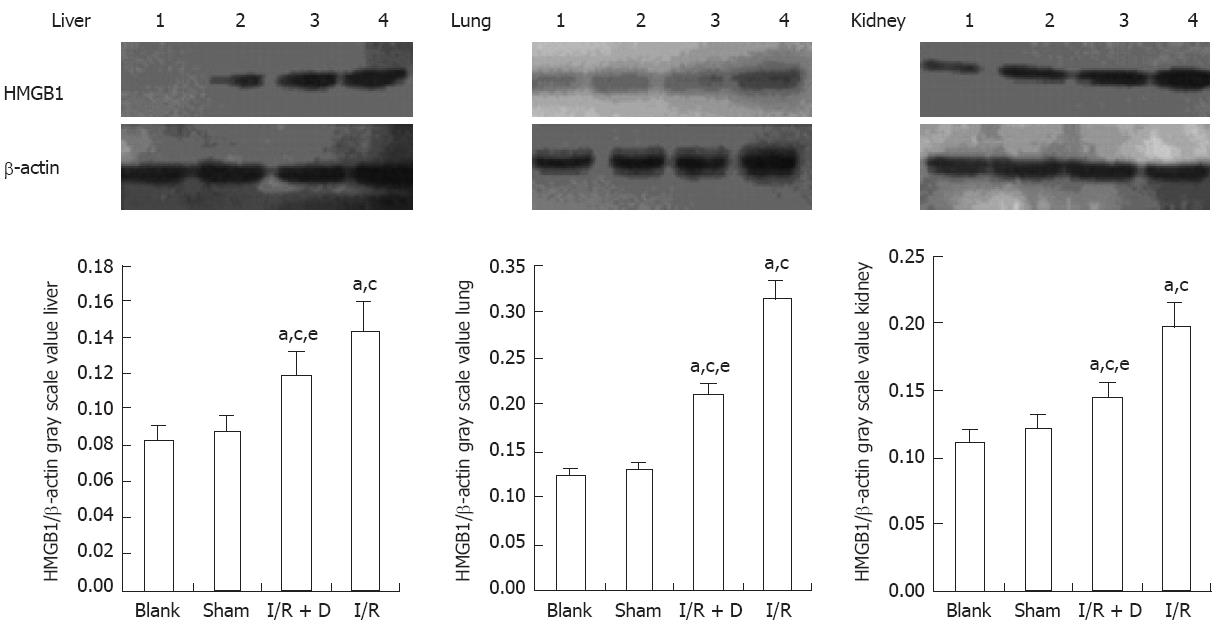
Figure 3 Expression levels of high mobility group protein box 1 in the liver, lung, and kidney (n = 8).
Top: Western blotting analysis of high mobility group protein box 1 (HMGB1) in the liver (left), lung (middle), and kidney (right). Lane 1: Blank; Lane 2: Sham; Lane 3: I/R + D; Lane 4: I/R; Bottom: Quantification of HMGB1 protein levels in the liver (left), lung (middle), and kidney (right). HMGB1 levels were normalized to the levels of the β-actin internal control. aP < 0.05 vs the blank group; cP < 0.05 vs the sham group; eP < 0.05 vs the I/R group. I/R + D: Ischemia/reperfusion and drainage; I/R: Ischemia/reperfusion.
- Citation: He GZ, Zhou KG, Zhang R, Wang YK, Chen XF. Impact of intestinal ischemia/reperfusion and lymph drainage on distant organs in rats. World J Gastroenterol 2012; 18(48): 7271-7278
- URL: https://www.wjgnet.com/1007-9327/full/v18/i48/7271.htm
- DOI: https://dx.doi.org/10.3748/wjg.v18.i48.7271


