Copyright
©2012 Baishideng Publishing Group Co.
World J Gastroenterol. Dec 28, 2012; 18(48): 7234-7241
Published online Dec 28, 2012. doi: 10.3748/wjg.v18.i48.7234
Published online Dec 28, 2012. doi: 10.3748/wjg.v18.i48.7234
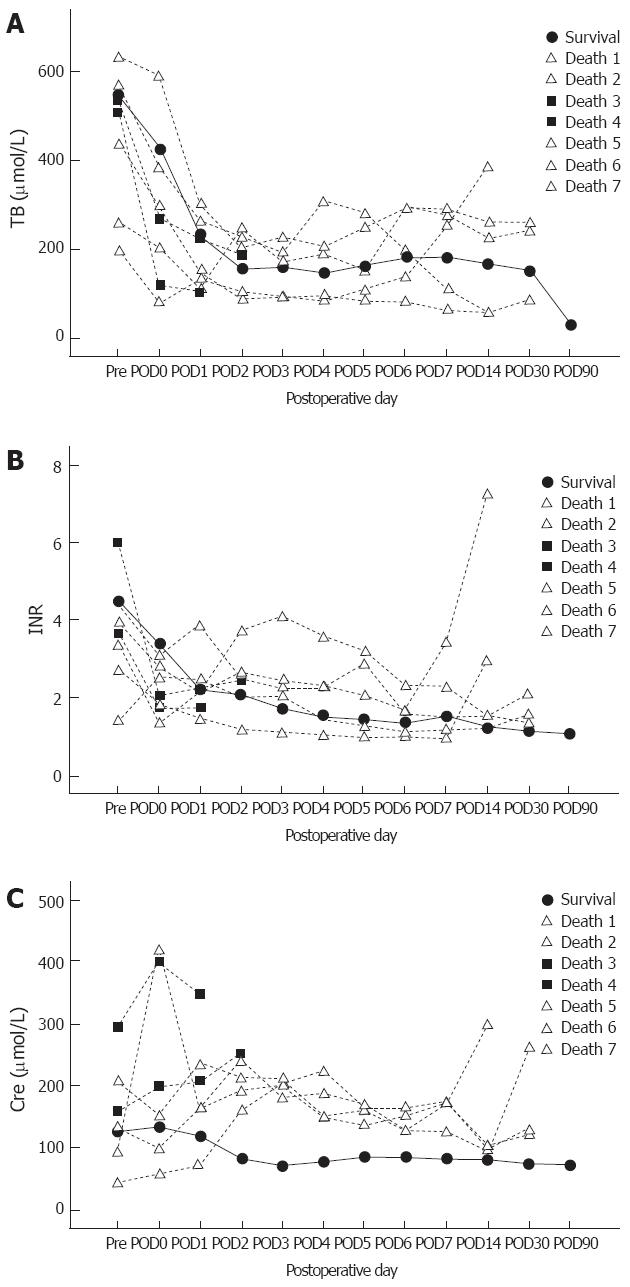
Figure 1 Hepatic and renal function change of all recipients with acute liver failure.
The solid line displays the mean of values level in survived recipients (n = 17). The dashed line displays the values level of seven dead recipients. The triangles show the dead recipients with survival time > 7 d, and the black boxs show the dead recipients with survival time < 2 d. A: Total bilirubin(TB) tendency; B: INR: International normalized ratio tendency; C: Creatinine (Cre) tendency.
- Citation: Yuan D, Liu F, Wei YG, Li B, Yan LN, Wen TF, Zhao JC, Zeng Y, Chen KF. Adult-to-adult living donor liver transplantation for acute liver failure in China. World J Gastroenterol 2012; 18(48): 7234-7241
- URL: https://www.wjgnet.com/1007-9327/full/v18/i48/7234.htm
- DOI: https://dx.doi.org/10.3748/wjg.v18.i48.7234


