Copyright
©2012 Baishideng Publishing Group Co.
World J Gastroenterol. Dec 28, 2012; 18(48): 7225-7233
Published online Dec 28, 2012. doi: 10.3748/wjg.v18.i48.7225
Published online Dec 28, 2012. doi: 10.3748/wjg.v18.i48.7225
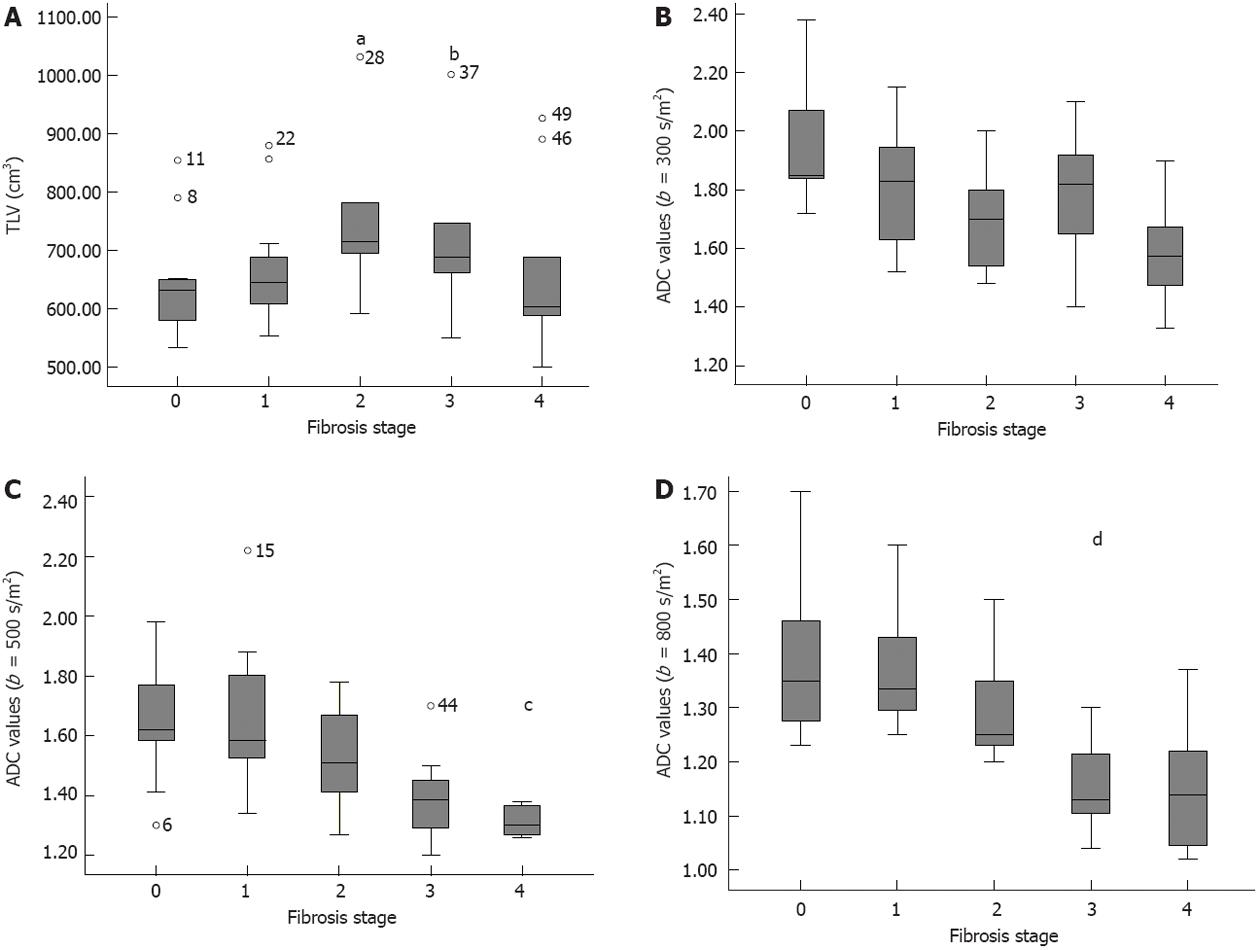
Figure 3 Box plots.
A-D: Total liver volume (TLV), and apparent diffusion coefficient (ADC) values of the liver for b = 300 s/mm2, 500 s/mm2 and 800 s/mm2 corresponding to fibrosis stages, respectively. In A, symbols a and b indicate extreme outliers of TLV in stage 2 and 3, respectively; and symbol c in C and symbol d in D indicate extreme outliers of ADC for b = 500 s/mm2 in stage 4 and for b = 800 s/mm2 in stage 3, respectively. Horizontal bars represent medians of TLV or ADC.
- Citation: Li H, Chen TW, Chen XL, Zhang XM, Li ZL, Zeng NL, Zhou L, Wang LY, Tang HJ, Li CP, Li L, Xie XY. Magnetic resonance-based total liver volume and magnetic resonance-diffusion weighted imaging for staging liver fibrosis in mini-pigs. World J Gastroenterol 2012; 18(48): 7225-7233
- URL: https://www.wjgnet.com/1007-9327/full/v18/i48/7225.htm
- DOI: https://dx.doi.org/10.3748/wjg.v18.i48.7225


