Copyright
©2012 Baishideng Publishing Group Co.
World J Gastroenterol. Dec 28, 2012; 18(48): 7225-7233
Published online Dec 28, 2012. doi: 10.3748/wjg.v18.i48.7225
Published online Dec 28, 2012. doi: 10.3748/wjg.v18.i48.7225
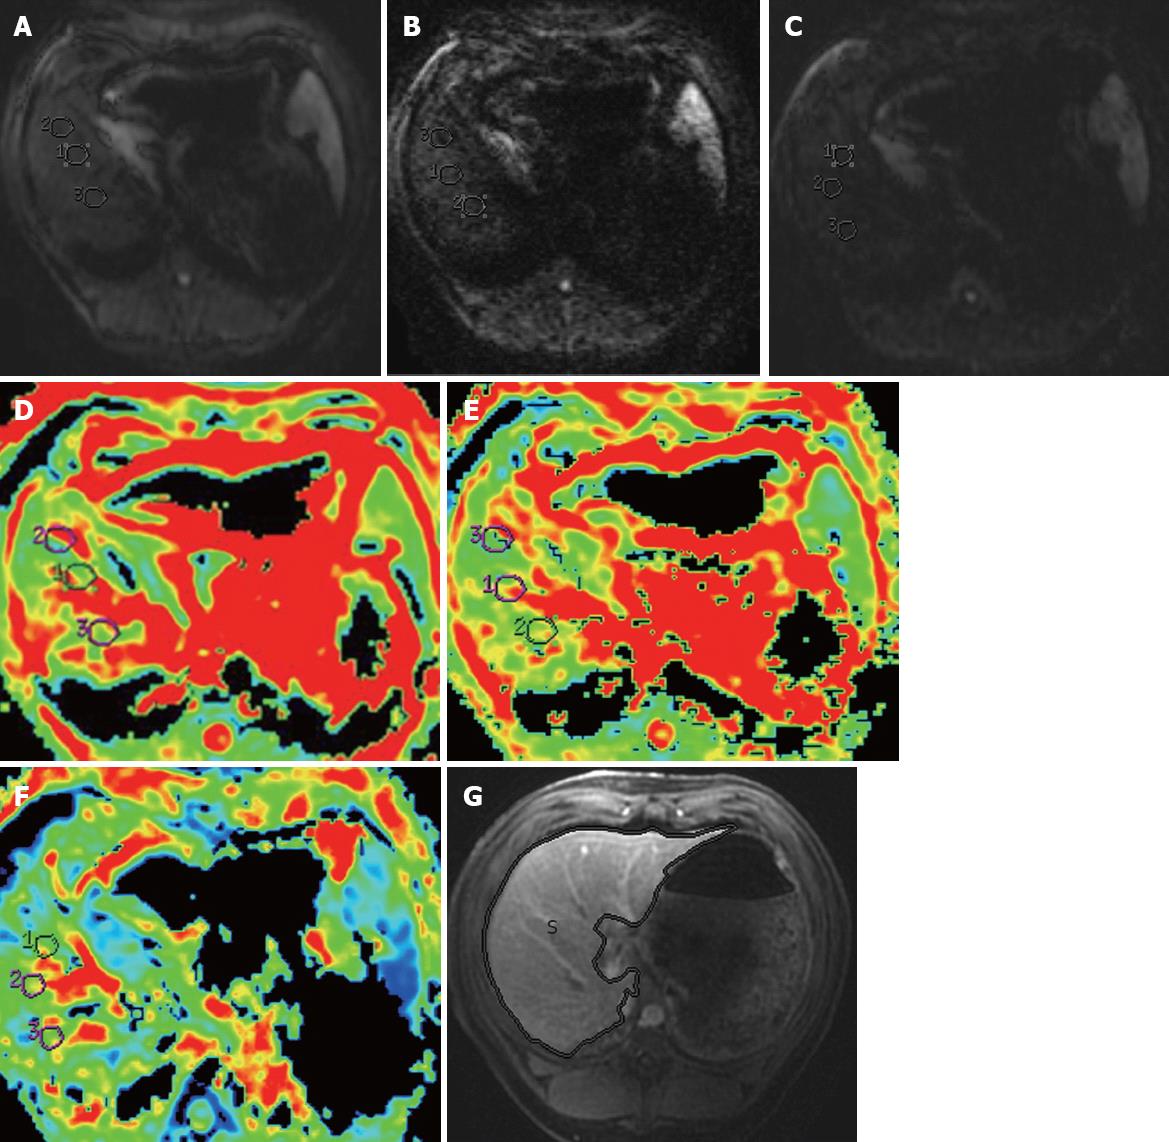
Figure 1 Magnetic resonance images.
A-C: In a mini-pig with liver fibrosis stage 2, diffusion weighted images of the liver are obtained with b values of 300, 500 and 800 s/mm2, respectively; D-F: Corresponding apparent diffusion coefficient maps. Three regions of interest are carefully drawn on the right lobes of the liver for each b values; G: A manual tracing of the liver is shown on an axial contrast-enhanced magnetic resonance imaging, and the outline shows the liver areas (S).
- Citation: Li H, Chen TW, Chen XL, Zhang XM, Li ZL, Zeng NL, Zhou L, Wang LY, Tang HJ, Li CP, Li L, Xie XY. Magnetic resonance-based total liver volume and magnetic resonance-diffusion weighted imaging for staging liver fibrosis in mini-pigs. World J Gastroenterol 2012; 18(48): 7225-7233
- URL: https://www.wjgnet.com/1007-9327/full/v18/i48/7225.htm
- DOI: https://dx.doi.org/10.3748/wjg.v18.i48.7225


