Copyright
©2012 Baishideng Publishing Group Co.
World J Gastroenterol. Dec 7, 2012; 18(45): 6635-6644
Published online Dec 7, 2012. doi: 10.3748/wjg.v18.i45.6635
Published online Dec 7, 2012. doi: 10.3748/wjg.v18.i45.6635
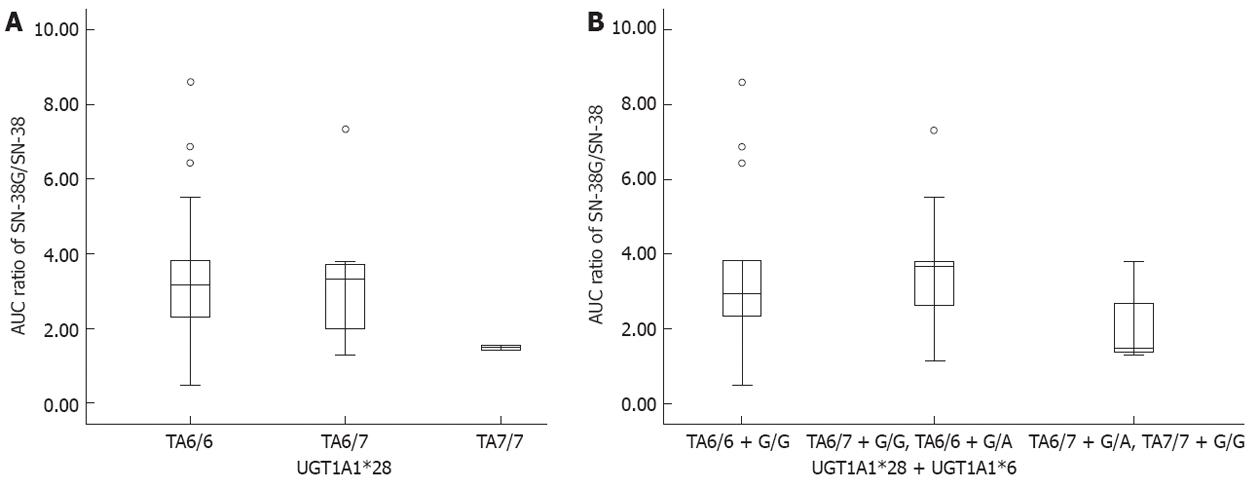
Figure 4 Area under concentration curve ratios of SN-38G/SN-38 comparison according to UDP-glucuronosyltransferase1A1*28 genotypes and UDP-glucuronosyltransferase1A1*28 + *6 group.
A: Area under concentration curve (AUC) ratios comparison by UDP-glucuronosyltransferase1A1 (UGT1A1)*28: The AUC ratio of TA7/7 was less than half of the TA6/6 ratio (1.488 vs 3.178, P = 0.158); B: AUC ratios comparison by UGT1A1*28 + *6 group: Lower AUC ratio was found in the double mutation group (TA6/7 + G/A and TA7/7 + G/G), compared with the other two groups [wild type or single mutation group (1.488 vs 3.177, P = 0.078)].
-
Citation: Wang Y, Shen L, Xu N, Wang JW, Jiao SC, Liu ZY, Xu JM.
UGT1A1 predicts outcome in colorectal cancer treated with irinotecan and fluorouracil. World J Gastroenterol 2012; 18(45): 6635-6644 - URL: https://www.wjgnet.com/1007-9327/full/v18/i45/6635.htm
- DOI: https://dx.doi.org/10.3748/wjg.v18.i45.6635


