Copyright
©2012 Baishideng Publishing Group Co.
World J Gastroenterol. Nov 28, 2012; 18(44): 6409-6419
Published online Nov 28, 2012. doi: 10.3748/wjg.v18.i44.6409
Published online Nov 28, 2012. doi: 10.3748/wjg.v18.i44.6409
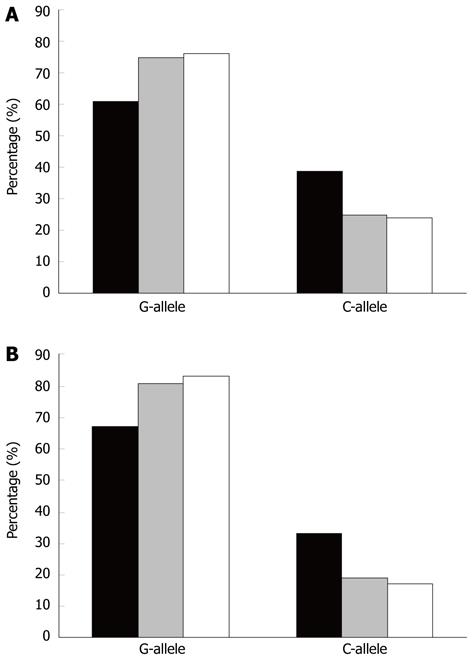
Figure 5 Distribution of allele frequencies, displaying the difference in patients with ulcerative colitis and dysplasia/cancer.
Bars represent the allele frequency (%) of ECP434 (A) and ECP562 (B) single nucleotide polymorphism in patients with dysplasia/cancer (black bar), all patients with ulcerative colitis (grey bar), and healthy individuals (white bar). ECP: Eosinophil cationic protein.
- Citation: Blom K, Rubin J, Halfvarson J, Törkvist L, Rönnblom A, Sangfelt P, Lördal M, Jönsson UB, Sjöqvist U, Håkansson LD, Venge P, Carlson M. Eosinophil associated genes in the inflammatory bowel disease 4 region: Correlation to inflammatory bowel disease revealed. World J Gastroenterol 2012; 18(44): 6409-6419
- URL: https://www.wjgnet.com/1007-9327/full/v18/i44/6409.htm
- DOI: https://dx.doi.org/10.3748/wjg.v18.i44.6409


