Copyright
©2012 Baishideng Publishing Group Co.
World J Gastroenterol. Nov 28, 2012; 18(44): 6409-6419
Published online Nov 28, 2012. doi: 10.3748/wjg.v18.i44.6409
Published online Nov 28, 2012. doi: 10.3748/wjg.v18.i44.6409
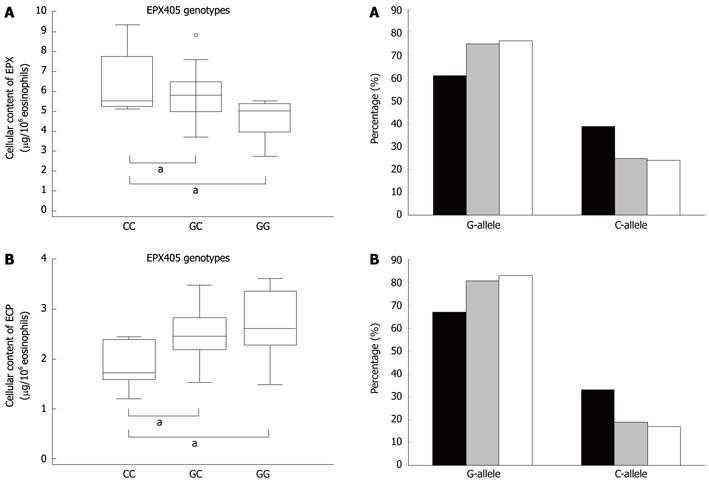
Figure 4 The box plots displays the association between the EPX405 genotypes and the intracellular content of eosinophil protein X and eosinophil cationic protein in eosinophils.
The box plots display the distribution of the protein content within each class of genotype. A: Intracellular content of eosinophil protein X (EPX) (ANOVA P = 0.009). aP < 0.05 vs EPX405 GG genotype (Student-Newman-Keuls test); B: Intracellular content of eosinophil cationic protein (ANOVA P = 0.022). aP < 0.05 vs the EPX405 CC genotype (Student-Newman-Keuls test).
- Citation: Blom K, Rubin J, Halfvarson J, Törkvist L, Rönnblom A, Sangfelt P, Lördal M, Jönsson UB, Sjöqvist U, Håkansson LD, Venge P, Carlson M. Eosinophil associated genes in the inflammatory bowel disease 4 region: Correlation to inflammatory bowel disease revealed. World J Gastroenterol 2012; 18(44): 6409-6419
- URL: https://www.wjgnet.com/1007-9327/full/v18/i44/6409.htm
- DOI: https://dx.doi.org/10.3748/wjg.v18.i44.6409


