Copyright
©2012 Baishideng Publishing Group Co.
World J Gastroenterol. Nov 28, 2012; 18(44): 6409-6419
Published online Nov 28, 2012. doi: 10.3748/wjg.v18.i44.6409
Published online Nov 28, 2012. doi: 10.3748/wjg.v18.i44.6409
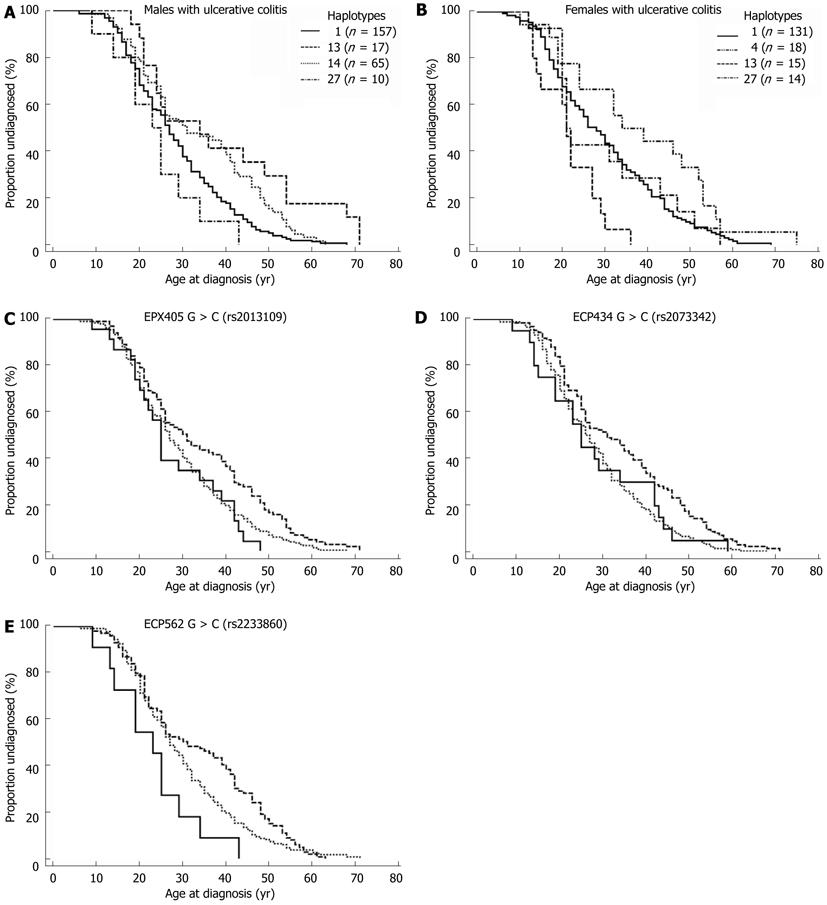
Figure 3 Kaplan-Meier Curve of four groups haplotypes and EPX405, ECP562 genotypes.
A: Kaplan-Meier Curve of four groups of haplotypes in male patients with ulcerative colitis (UC) (P = 0.0009); B: Kaplan-Meier Curve of four groups of haplotypes in female patients with Crohn’s disease (P = 0.003); C: Kaplan-Meier curve of the EPX405 genotype in men with UC (P = 0.007); D: Curve of the ECP434 genotype in men with UC (P = 0.002); E: Curve of the ECP562 genotype in males with UC (P = 0.01). Dotted line: GG genotype; Dashed line: GC genotype; Continuous line: CC genotype. ECP: Eosinophil cationic protein; EPX: Eosinophil protein X.
- Citation: Blom K, Rubin J, Halfvarson J, Törkvist L, Rönnblom A, Sangfelt P, Lördal M, Jönsson UB, Sjöqvist U, Håkansson LD, Venge P, Carlson M. Eosinophil associated genes in the inflammatory bowel disease 4 region: Correlation to inflammatory bowel disease revealed. World J Gastroenterol 2012; 18(44): 6409-6419
- URL: https://www.wjgnet.com/1007-9327/full/v18/i44/6409.htm
- DOI: https://dx.doi.org/10.3748/wjg.v18.i44.6409


