Copyright
©2012 Baishideng Publishing Group Co.
World J Gastroenterol. Nov 28, 2012; 18(44): 6409-6419
Published online Nov 28, 2012. doi: 10.3748/wjg.v18.i44.6409
Published online Nov 28, 2012. doi: 10.3748/wjg.v18.i44.6409
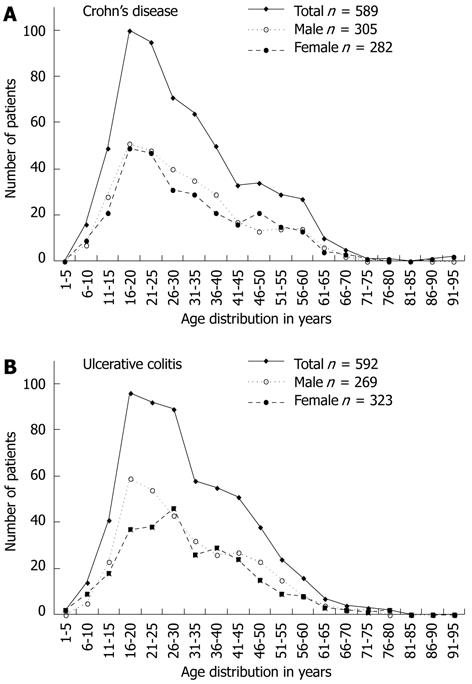
Figure 1 Incidence curves, given as a mean of 5 consecutive years, are shown for the inflammatory bowel disease study cohort.
Curves separated by gender and displaying the total inflammatory bowel disease cohort are included.
- Citation: Blom K, Rubin J, Halfvarson J, Törkvist L, Rönnblom A, Sangfelt P, Lördal M, Jönsson UB, Sjöqvist U, Håkansson LD, Venge P, Carlson M. Eosinophil associated genes in the inflammatory bowel disease 4 region: Correlation to inflammatory bowel disease revealed. World J Gastroenterol 2012; 18(44): 6409-6419
- URL: https://www.wjgnet.com/1007-9327/full/v18/i44/6409.htm
- DOI: https://dx.doi.org/10.3748/wjg.v18.i44.6409


