Copyright
©2012 Baishideng Publishing Group Co.
World J Gastroenterol. Nov 21, 2012; 18(43): 6269-6276
Published online Nov 21, 2012. doi: 10.3748/wjg.v18.i43.6269
Published online Nov 21, 2012. doi: 10.3748/wjg.v18.i43.6269
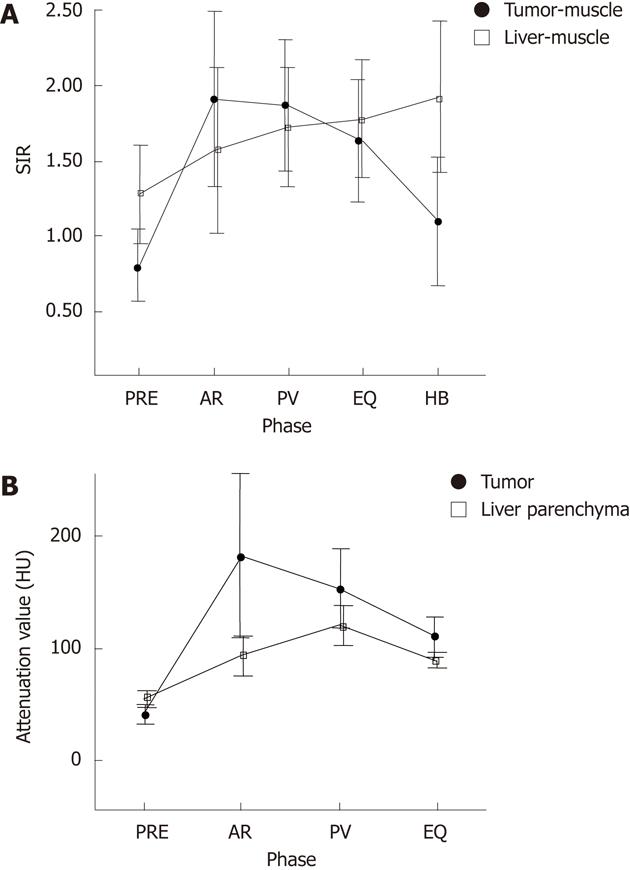
Figure 2 Temporal profiles of the signal intensity ratios on gadolinium-ethoxybenzyl-diethylenetriaminpentaacetic acid-enhanced magnetic resonance imaging and the attenuation values on enhanced computed tomography.
A: Tumor-muscle and liver-muscle signal intensity ratios (SIRs) before and after gadolinium-ethoxybenzyl-diethylenetriamin-pentaacetic acid (Gd-EOB-DTPA) injection; B: The attenuation values in the tumor and liver parenchyma before and after nonionic contrast material injection. Tumor-muscle SIR = signal intensity of the hemangiomas/signal intensity of the paravertebral muscle; Liver-muscle SIR = signal intensity of the liver parenchyma/signal intensity of the paravertebral muscle. PRE: Precontrast scan; AR: Arterial phase; PV: Portal venous phase; EQ: Equilibrium phase; HB: Hepatobiliary phase; HU: Hounsfield unit.
- Citation: Tateyama A, Fukukura Y, Takumi K, Shindo T, Kumagae Y, Kamimura K, Nakajo M. Gd-EOB-DTPA-enhanced magnetic resonance imaging features of hepatic hemangioma compared with enhanced computed tomography. World J Gastroenterol 2012; 18(43): 6269-6276
- URL: https://www.wjgnet.com/1007-9327/full/v18/i43/6269.htm
- DOI: https://dx.doi.org/10.3748/wjg.v18.i43.6269


