Copyright
©2012 Baishideng Publishing Group Co.
World J Gastroenterol. Nov 21, 2012; 18(43): 6226-6234
Published online Nov 21, 2012. doi: 10.3748/wjg.v18.i43.6226
Published online Nov 21, 2012. doi: 10.3748/wjg.v18.i43.6226
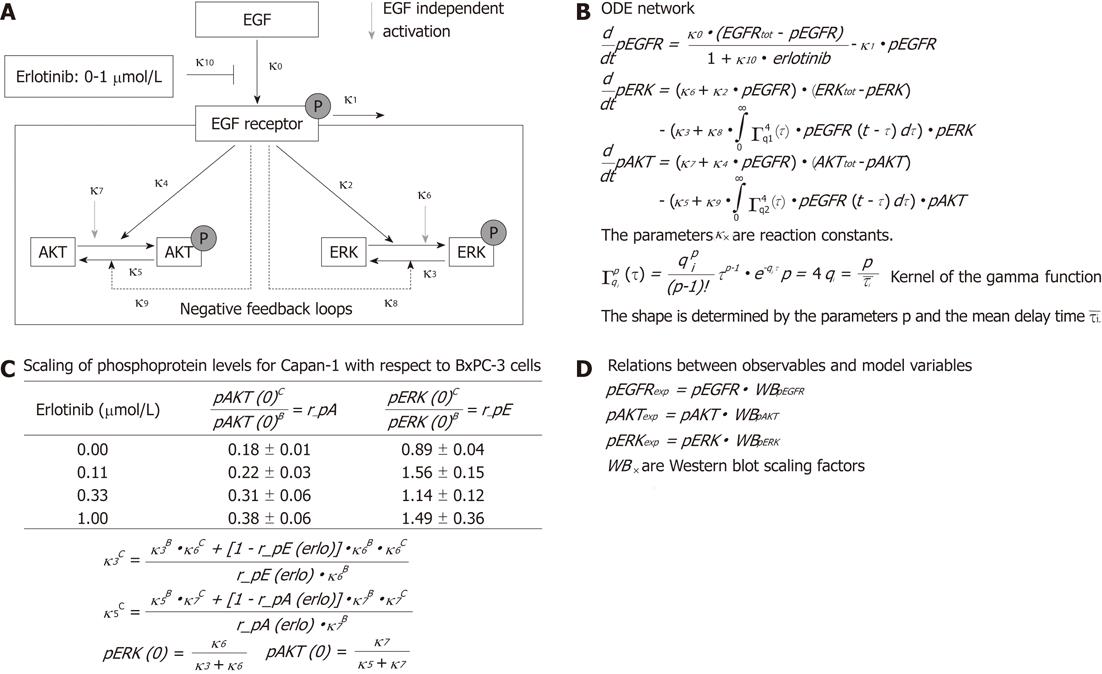
Figure 1 Flow chart of epidermal growth factor signal transduction and the ordinary differential equation network.
A: Simplified reaction network. Solid black arrows show epidermal growth factor-dependent processes, whereas grey arrows represent basal phosphorylation. Two epidermal growth factor receptor (EGFR)-dependent negative feedback loops are shown by black dotted lines; B: Translation of the reaction network into an ordinary differential equation (ODE) model describing EGFR-mediated signal transduction; C: Ratio of basal levels of phosphorylated protein kinase B (AKT) (r_pA) and extracellular signal-regulated kinase (ERK) (r_pE) in BxPC-3 (superscript B) and Capan-1 (superscript C) cells. These calculations are implemented in the mathematical model; D: Equations describe relations between observables (fitted to experimental data) and model variables. For further description see “mathematical model” in the “materials and methods” section. EGF: Epidermal growth factor; pAKT: Phospho-AKT; ERK: Extracellular signal-regulated kinase; pERK: Phospho-ERK; WB: Western blot.
- Citation: Lange F, Rateitschak K, Kossow C, Wolkenhauer O, Jaster R. Insights into erlotinib action in pancreatic cancer cells using a combined experimental and mathematical approach. World J Gastroenterol 2012; 18(43): 6226-6234
- URL: https://www.wjgnet.com/1007-9327/full/v18/i43/6226.htm
- DOI: https://dx.doi.org/10.3748/wjg.v18.i43.6226


