Copyright
©2012 Baishideng Publishing Group Co.
World J Gastroenterol. Nov 14, 2012; 18(42): 6076-6087
Published online Nov 14, 2012. doi: 10.3748/wjg.v18.i42.6076
Published online Nov 14, 2012. doi: 10.3748/wjg.v18.i42.6076
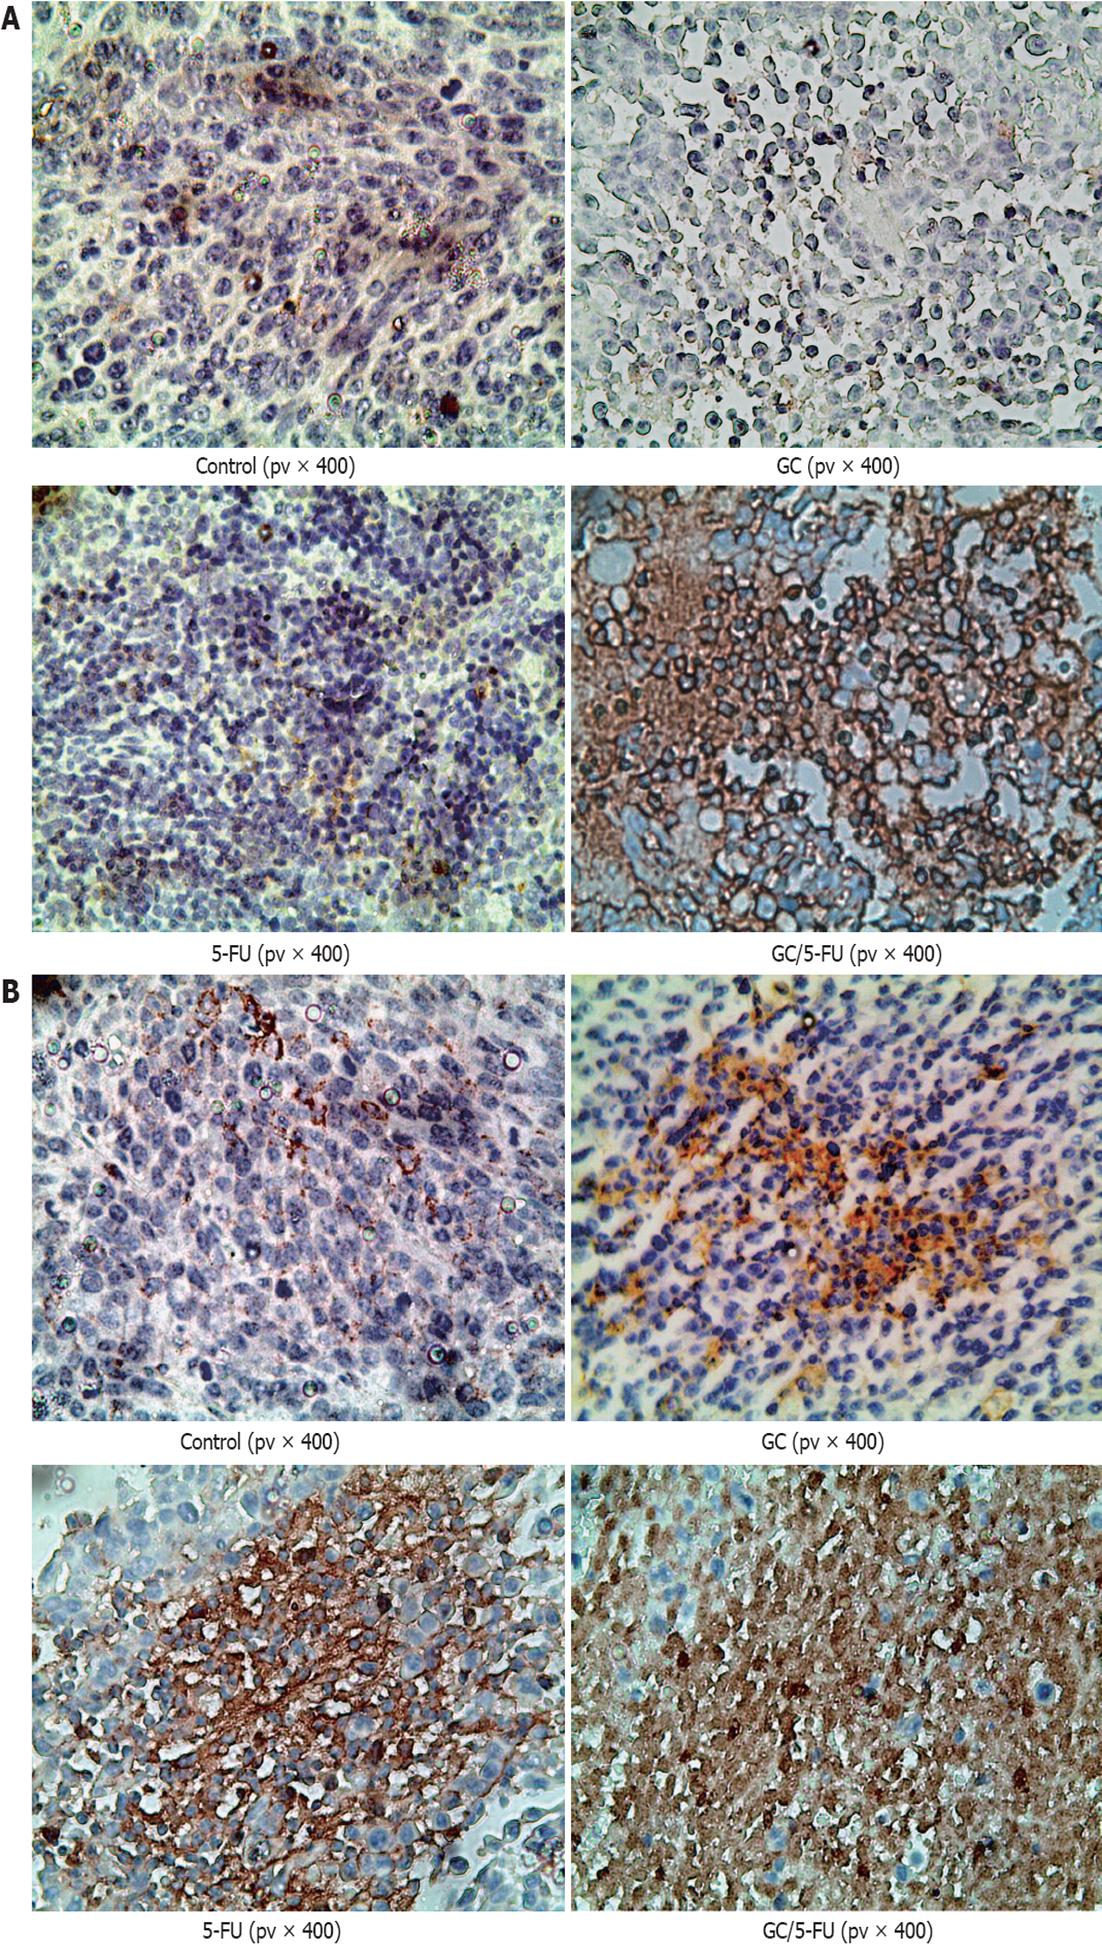
Figure 6 Immunohistochemistry of p53 and caspase-3 in the tumor sections from mice with different treatments.
A: p53 staining in the control and galactosylated chitosan (GC) groups showed a scattered nuclear distribution pattern, in dark yellow or dark brown; while in 5-fluorouracil (5-FU) and GC/5-FU groups, p53 showed a sheet staining pattern, which was more dramatic; B: Caspase-3 staining in the control and GC groups showed a scattered cytoplasmic distribution pattern, in dark yellow or dark brown; while in 5-FU and GC/5-FU groups, caspase-3 showed a sheet staining pattern, which was more dramatic in the GC/5-FU group.
- Citation: Cheng MR, Li Q, Wan T, He B, Han J, Chen HX, Yang FX, Wang W, Xu HZ, Ye T, Zha BB. Galactosylated chitosan/5-fluorouracil nanoparticles inhibit mouse hepatic cancer growth and its side effects. World J Gastroenterol 2012; 18(42): 6076-6087
- URL: https://www.wjgnet.com/1007-9327/full/v18/i42/6076.htm
- DOI: https://dx.doi.org/10.3748/wjg.v18.i42.6076


