Copyright
©2012 Baishideng Publishing Group Co.
World J Gastroenterol. Nov 14, 2012; 18(42): 6076-6087
Published online Nov 14, 2012. doi: 10.3748/wjg.v18.i42.6076
Published online Nov 14, 2012. doi: 10.3748/wjg.v18.i42.6076
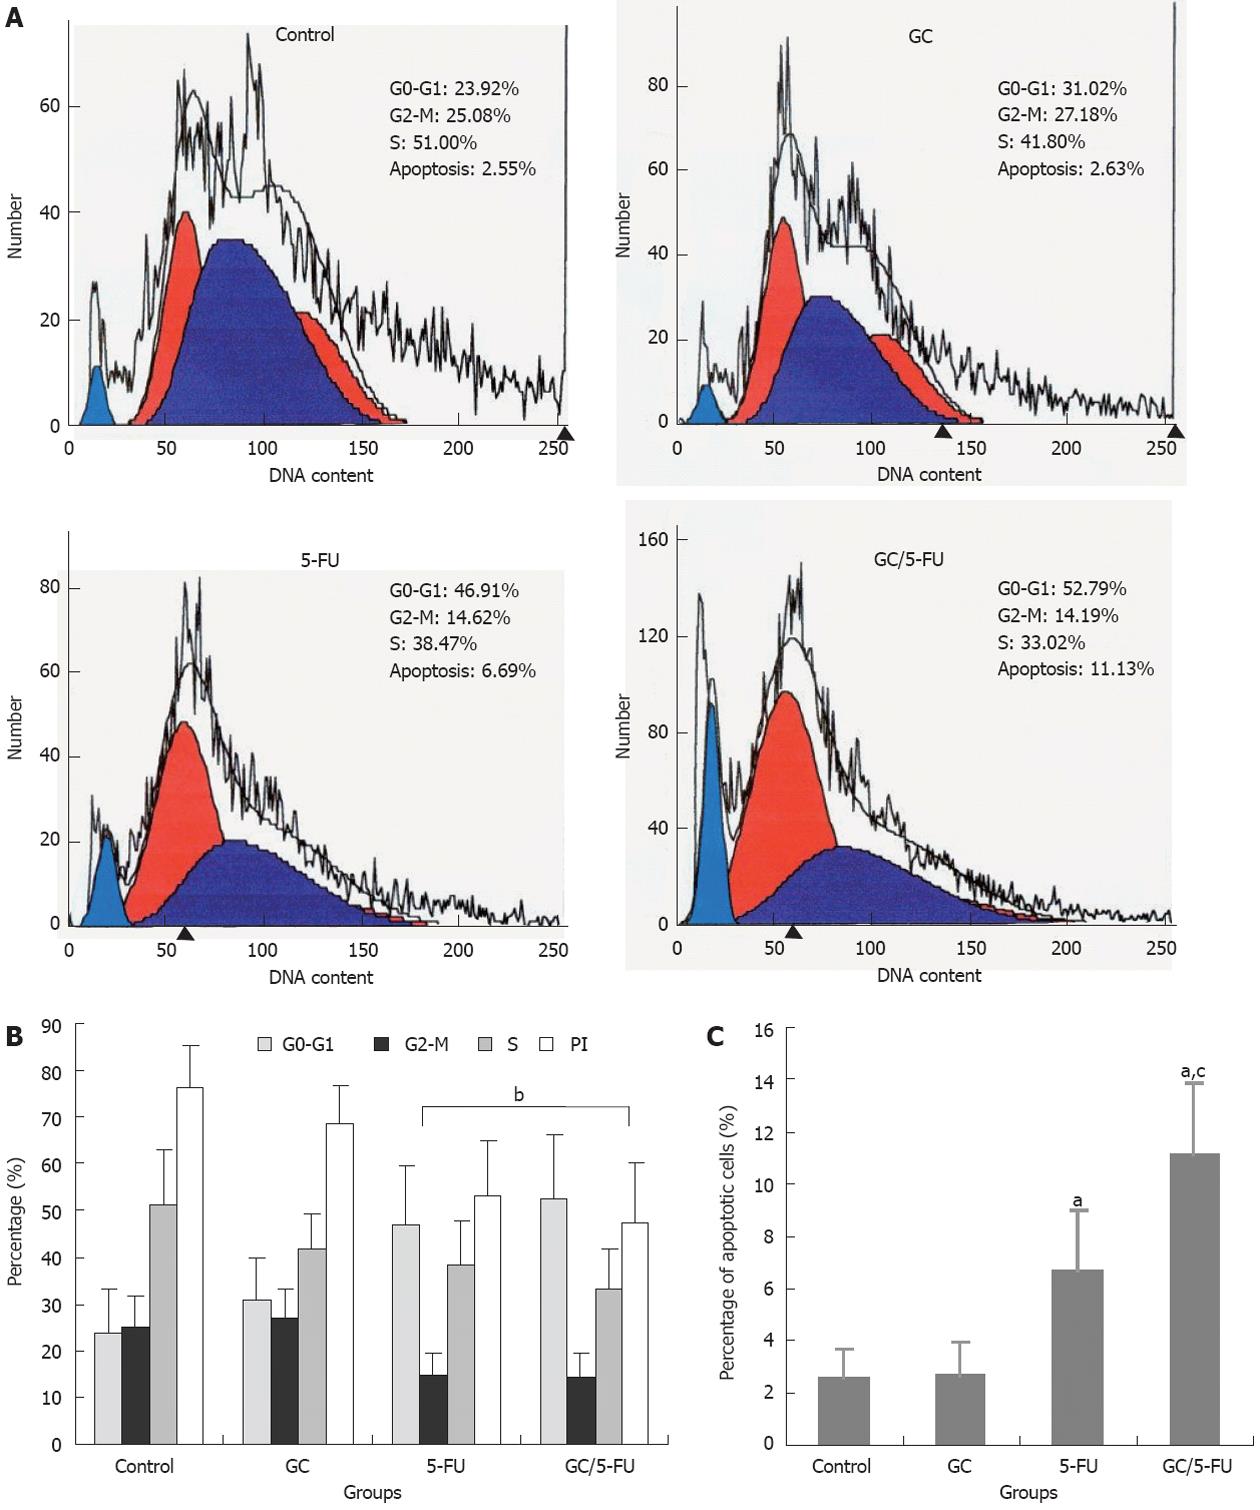
Figure 5 The effects of different treatments on cell cycle, proliferation index and apoptosis index.
A: Flow cytometry analysis of cell cycle distribution of mouse liver cancer cell line (H22) cells; B: Quantification of cell cycle distribution and proliferation index of H22 cells. Percentage of cells in G0-G1 in the galactosylated chitosan/5-fluorouracil (GC/5-FU) and 5-FU groups was higher than that in control and GC groups, while the proliferation index (PI) decreased significantly (P < 0.01); C: Quantification of apoptosis of H22 in different treatment groups. aP < 0.05, bP < 0.01 vs control group; cP < 0.05 vs 5-FU group.
- Citation: Cheng MR, Li Q, Wan T, He B, Han J, Chen HX, Yang FX, Wang W, Xu HZ, Ye T, Zha BB. Galactosylated chitosan/5-fluorouracil nanoparticles inhibit mouse hepatic cancer growth and its side effects. World J Gastroenterol 2012; 18(42): 6076-6087
- URL: https://www.wjgnet.com/1007-9327/full/v18/i42/6076.htm
- DOI: https://dx.doi.org/10.3748/wjg.v18.i42.6076


