Copyright
©2012 Baishideng Publishing Group Co.
World J Gastroenterol. Nov 14, 2012; 18(42): 6018-6026
Published online Nov 14, 2012. doi: 10.3748/wjg.v18.i42.6018
Published online Nov 14, 2012. doi: 10.3748/wjg.v18.i42.6018
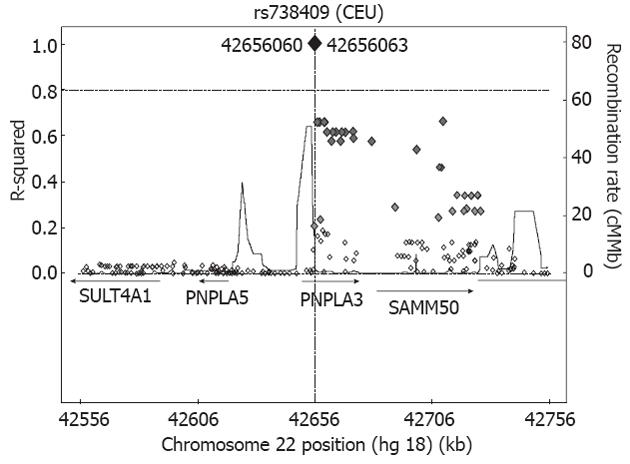
Figure 5 Regional Linkage disequilibrium plot for the rs738409 at chromosome 22 (22q13.
31). The single nucleotide polymorphisms are plotted with their proxies (showed as diamonds) (based on HapMap data for CEU) as a function of genomic location, annotated by the recombination rate across the locus and nearby genes. The regional association plot was performed by the SNAP server, available at http://www.broad.mit.edu/mpg/snap/. SULT4A1: Sulfotransferase-4A1; PNPLA5: Patatin-like phospholipase domain containing 5; PNPLA3: Patatin-like phospholipase domain containing 3; SAMM50: Sorting and assembly machinery component 50 homolog.
- Citation: Sookoian S, Pirola CJ. PNPLA3, the triacylglycerol synthesis/hydrolysis/storage dilemma, and nonalcoholic fatty liver disease. World J Gastroenterol 2012; 18(42): 6018-6026
- URL: https://www.wjgnet.com/1007-9327/full/v18/i42/6018.htm
- DOI: https://dx.doi.org/10.3748/wjg.v18.i42.6018


