Copyright
©2012 Baishideng Publishing Group Co.
World J Gastroenterol. Nov 14, 2012; 18(42): 6018-6026
Published online Nov 14, 2012. doi: 10.3748/wjg.v18.i42.6018
Published online Nov 14, 2012. doi: 10.3748/wjg.v18.i42.6018
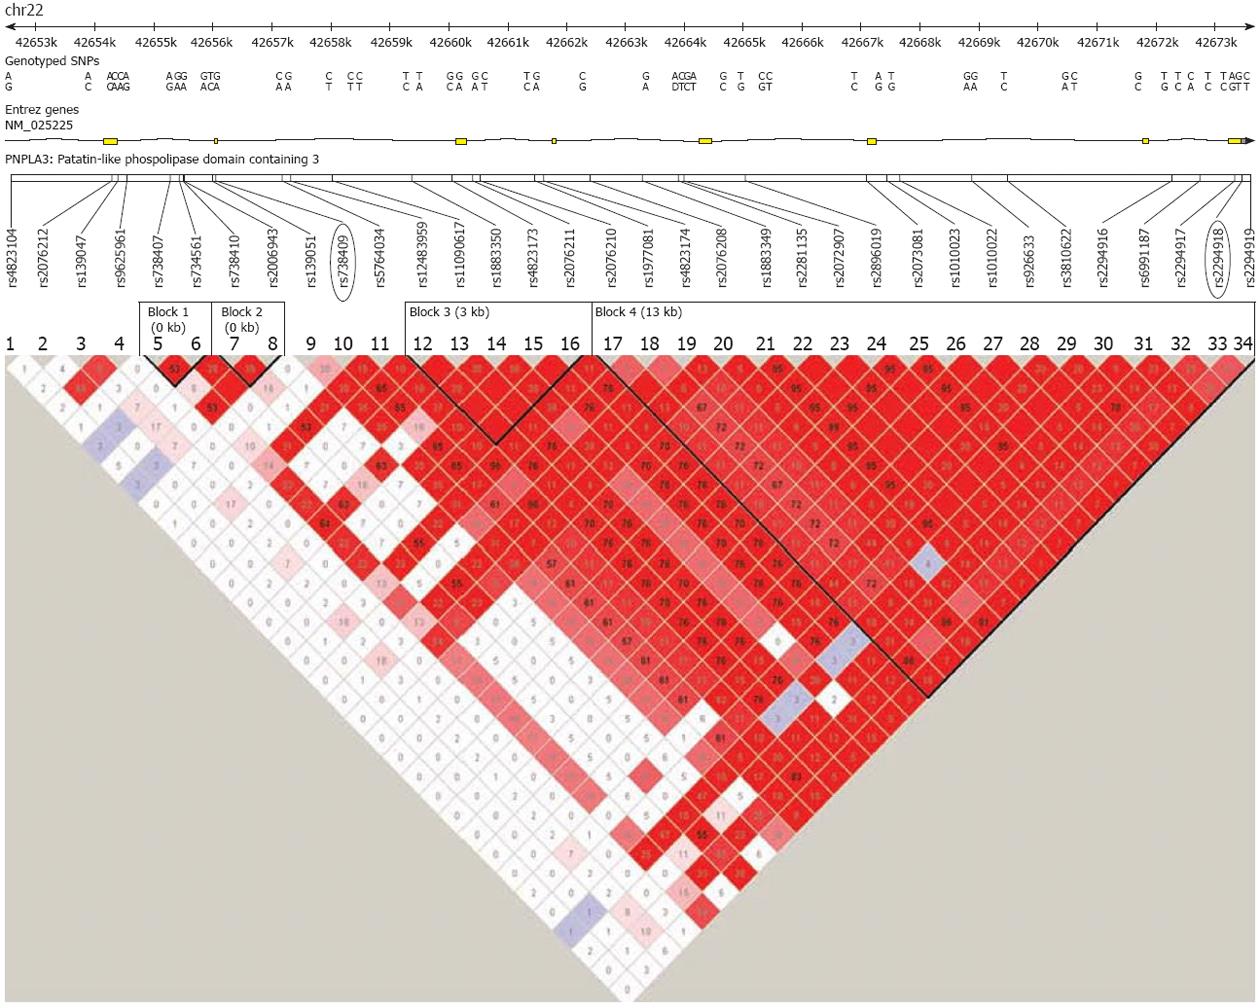
Figure 4 Linkage disequilibrium plot across the patatin-like phospholipase domain containing 3 gene.
The horizontal white line depicts the DNA segment of chromosome 22q13.31. The rs738409 location is highlighted in a black ellipse. An LD plot is depicted in the bottom part of the figure: each diamond represents the magnitude of LD for a single pair of markers, with colors indicating strong LD (red r2 = 1.0) and no LD (white, rr = 0) as the extremes (different red tones indicate intermediate LD). Numbers inside the diamonds stand for r2 values. Haplotype analysis of PNPLA3 shows that the rs738409 is in moderate LD (no more than r2: 0.65) with other variants. Plot was obtained by the software Haploview 2.0 freely available at http://www.broad.mit.edu/mpg/haploview/. LD: Linkage disequilibrium; PNPLA3: Patatin-like phospholipase domain containing 3.
- Citation: Sookoian S, Pirola CJ. PNPLA3, the triacylglycerol synthesis/hydrolysis/storage dilemma, and nonalcoholic fatty liver disease. World J Gastroenterol 2012; 18(42): 6018-6026
- URL: https://www.wjgnet.com/1007-9327/full/v18/i42/6018.htm
- DOI: https://dx.doi.org/10.3748/wjg.v18.i42.6018


