Copyright
©2012 Baishideng Publishing Group Co.
World J Gastroenterol. Nov 7, 2012; 18(41): 5879-5888
Published online Nov 7, 2012. doi: 10.3748/wjg.v18.i41.5879
Published online Nov 7, 2012. doi: 10.3748/wjg.v18.i41.5879
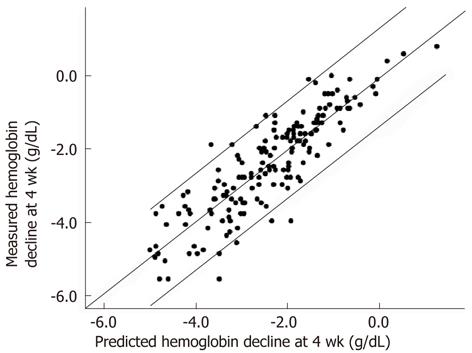
Figure 4 Correlation between predicted and measured values of hemoglobin decline at week 4 of treatment.
Predicted values were yielded by the multiple linear regression model that was constructed in the derivation group. Measured values were derived from the confirmatory group. There was a significant correlation between predicted and measured values (Spearman’s ρ = 0.880, P = 1.16 × 10-56). The area between lower and upper parallel lines of the diagonal line includes 95% of patients analyzed.
-
Citation: Tsubota A, Shimada N, Abe H, Yoshizawa K, Agata R, Yumoto Y, Ika M, Namiki Y, Nagatsuma K, Matsudaira H, Fujise K, Tada N, Aizawa Y. Several factors including
ITPA polymorphism influence ribavirin-induced anemia in chronic hepatitis C. World J Gastroenterol 2012; 18(41): 5879-5888 - URL: https://www.wjgnet.com/1007-9327/full/v18/i41/5879.htm
- DOI: https://dx.doi.org/10.3748/wjg.v18.i41.5879


