Copyright
©2012 Baishideng Publishing Group Co.
World J Gastroenterol. Nov 7, 2012; 18(41): 5879-5888
Published online Nov 7, 2012. doi: 10.3748/wjg.v18.i41.5879
Published online Nov 7, 2012. doi: 10.3748/wjg.v18.i41.5879
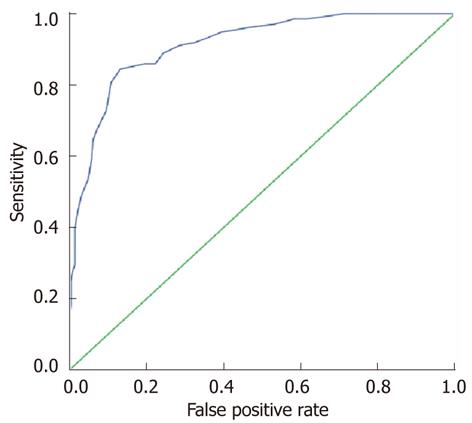
Figure 3 Receiver operating characteristic curves generated with every cut-off point of predicted probability of significant hemoglobin decline (> 3.
0 g/dL at week 4 of treatment) corresponding to each hemoglobin decline from baseline at week 2 of treatment. The area under the curve was 0.913 (95% confidence interval: 0.885-0.941, P = 4.08 × 10-43). When the sensitivity and false-positive rate were 0.844 and 0.131, the Youden’s index value of 0.713 was maximal. The optimal cut-off point of hemoglobin decline at 2 wk was 1.45 g/dL.
-
Citation: Tsubota A, Shimada N, Abe H, Yoshizawa K, Agata R, Yumoto Y, Ika M, Namiki Y, Nagatsuma K, Matsudaira H, Fujise K, Tada N, Aizawa Y. Several factors including
ITPA polymorphism influence ribavirin-induced anemia in chronic hepatitis C. World J Gastroenterol 2012; 18(41): 5879-5888 - URL: https://www.wjgnet.com/1007-9327/full/v18/i41/5879.htm
- DOI: https://dx.doi.org/10.3748/wjg.v18.i41.5879


