Copyright
©2012 Baishideng Publishing Group Co.
World J Gastroenterol. Oct 28, 2012; 18(40): 5821-5825
Published online Oct 28, 2012. doi: 10.3748/wjg.v18.i40.5821
Published online Oct 28, 2012. doi: 10.3748/wjg.v18.i40.5821
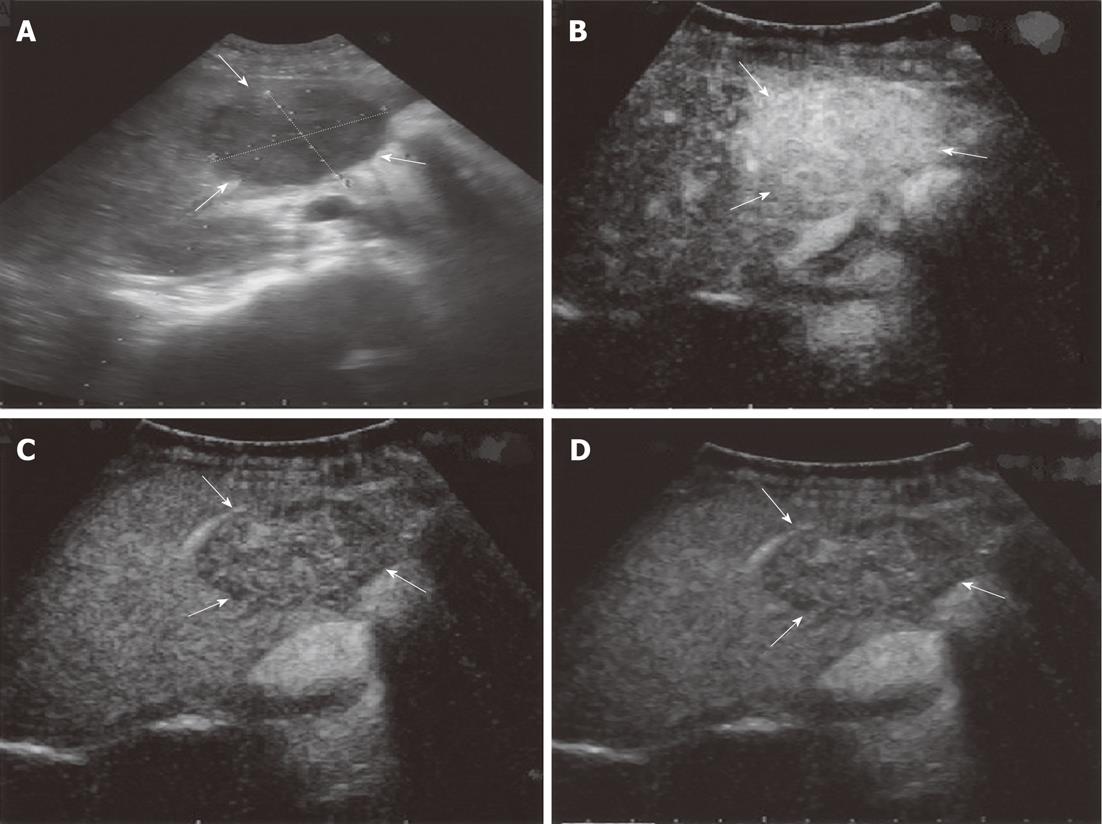
Figure 1 Ultrasonography images of the liver inflammatory myofibroblastic tumor.
A: Conventional ultrasonography showing a 3.8 cm × 4.6 cm hypoechoic mass in the right anterior lobe of the liver, with a clearly defined border (white arrows); B: Arterial-phase images showing a hyperenhanced mass on the liver (white arrows); C: Portal venous-phase images showing slight enhancement and wash-out of the mass, which corresponded to that seen on arterial-phase images (white arrows); D: Parenchymal-phase images showing further wash-out of the mass, which corresponded to that on arterial-phase images (white arrows).
- Citation: Liu XF, He BM, Ou-Yang XH, Wang ZZ, Su JG. Different imaging findings of inflammatory myofibroblastic tumor of the liver. World J Gastroenterol 2012; 18(40): 5821-5825
- URL: https://www.wjgnet.com/1007-9327/full/v18/i40/5821.htm
- DOI: https://dx.doi.org/10.3748/wjg.v18.i40.5821


