Copyright
©2012 Baishideng Publishing Group Co.
World J Gastroenterol. Oct 28, 2012; 18(40): 5753-5758
Published online Oct 28, 2012. doi: 10.3748/wjg.v18.i40.5753
Published online Oct 28, 2012. doi: 10.3748/wjg.v18.i40.5753
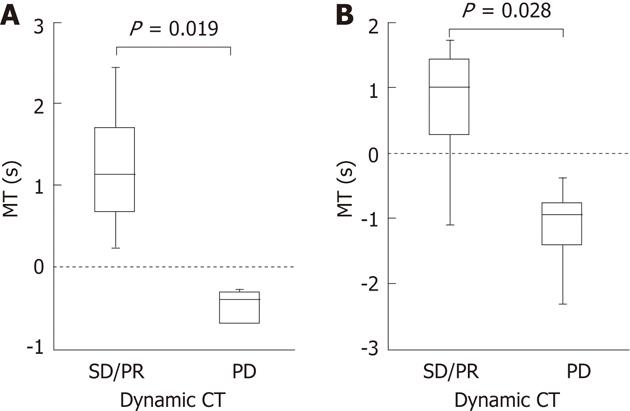
Figure 3 Comparisons between the mean time and therapeutic effects according to modified response evaluation criteria in solid tumors evaluated by dynamic computed tomography.
A: Median difference in the mean time (MT) was 1.13 s, 2 wk after the treatment in the 8 patients who showed stable disease (SD)/partial response (PR) on dynamic computed tomography (CT). Median difference in the MT was -0.39 s, 2 wk after the treatment in the 5 patients who showed progressive disease (PD); B: Median difference in the MT was 1.015 s, 4 wk after the treatment, in the 8 patients who showed SD/PR on dynamic CT. Median difference in the MT was -0.95 s 4 wk after the treatment in the 5 patients who showed PD. Differences in the median MT between SD/PR and PD groups were significant 2 and 4 wk after the treatment with P = 0.019 and P = 0.028, respectively.
- Citation: Shiozawa K, Watanabe M, Kikuchi Y, Kudo T, Maruyama K, Sumino Y. Evaluation of sorafenib for hepatocellular carcinoma by contrast-enhanced ultrasonography: A pilot study. World J Gastroenterol 2012; 18(40): 5753-5758
- URL: https://www.wjgnet.com/1007-9327/full/v18/i40/5753.htm
- DOI: https://dx.doi.org/10.3748/wjg.v18.i40.5753


